
Download
RESEARCH ARTICLE
Geospatial distribution of mycotoxins in wheat collected in summer and winter seasons from a selected area
Naseem Zahra1,2, Nadia Jamil2, Muhammad Khalid Saeed1, Asif Javed2, Najeeb Ullah1, Nadeem Ullah3, Abid Sarwar1, Tariq Aziz4,5*, Rania Ali El Hadi Mohamed6, Fahad Al-Asmari7, Fakhria A. Al-Joufi8
1Food and Biotechnology Research Centre, Pakistan Council of Scientific & Industrial Research Laboratories Complex, Lahore, Pakistan;
2College of Earth and Environmental Sciences, University of the Punjab, Lahore, Pakistan;
3Department of Biotechnology, Faculty of Science and Technology, University of Central Punjab Lahore Pakistan;
4Laboratory of Animal Health Food Hygiene and Quality, University of Ioannina, Arta, Greece;
5Institute of Molecular Biology and Biotechnology, The University of Lahore Punjab Pakistan;
6Department of Biology, College of Science, Princess Nourah bint Abdulrahman University, P.O. Box 84428, Riyadh 11671, Saudi Arabia;
7Department of Food and Nutrition Sciences, College of Agricultural and Food Sciences, King Faisal University, Al Ahsa, Saudi Arabia;
8Department of Pharmacology, College of Pharmacy, Jouf University, 72341 Aljouf, Saudi Arabia
Abstract
Mycotoxins are toxic metabolites generated by various fungal species. Mycotoxins in wheat may pose dangers for the health of consumers as most of them are potent carcinogens. The objective of this study was to check the level of contamination by multiple mycotoxins in wheat samples obtained from local stores in Lahore, during the summer and winter seasons. HPLC coupled with the diode array detector (DAD) was utilized for the quantification of multiple mycotoxins. In total, 50% of wheat samples were contaminated with multiple mycotoxins. This exceeds the allowable limit set by the European Union. The highest levels of total aflatoxins (AFs), ochratoxins (OTAs), deoxynivalenol (DON), and fumonisins (FUMs) were found to be 115.19 μg/kg, 24.13 μg/kg, 112.00 mg/kg, and 2.81 mg/kg, respectively. The contamination levels in wheat samples were as follows: AF (0.56–115.19 μg/kg), OTA (0.12–24.13 μg/kg), DON (0.01–112.00 mg/kg), and FUMs (0.02–2.81 mg/kg). The presence of multiple mycotoxins was observed to be more rampant in wheat gathered during summer compared to winter. Nonetheless, a statistically significant difference (p<0.05) was observed among AF, OTA, and DON in both seasons, whereas no significant difference (p>0.05) was detected for FUM. This research highlighted the geospatial distribution of contamination by multiple mycotoxins in wheat, and the results are quite alarming. It is essential to actively monitor contamination by multiple mycotoxins in wheat crops to ensure safety and safeguard consumer health.
Key words: Aflatoxin, ochratoxin, deoxynivalenol, fumonisins, HPLC
*Corresponding Author: Tariq Aziz, Laboratory of Animal Health Food Hygiene and Quality, University of Ioannina, Arta, Greece, E-mail: [email protected]
Academic Editor: Prof. Ana Sanches-Silva, University of Coimbra, Portugal
Received: 19 February 2025; Accepted: 7 April 2025; Published: 1 July 2025
© 2025 Codon Publications
This is an Open Access article distributed under the terms of the Creative Commons Attribution-NonCommercial-ShareAlike 4.0 International (CC BY-NC-SA 4.0). License (http://creativecommons.org/licenses/by-nc-sa/4.0/)
Introduction
Pakistan ranks sixth among wheat-producing countries, with approximately 24 million tons cultivated in 2010 (Iqbal et al., 2013). Although wheat is grown throughout the country, maximum yields are achieved in Punjab and Sindh. Because of outdated agricultural methods and the leakage of toxins from unsuitable storage, wheat becomes infected and contaminated with mycotoxins, rendering it unfit for human consumption (Nada et al., 2022). According to Asif I. (2024), the average annual wheat production in Pakistan, which is a staple food, amounts to 24 million tons, which is sufficient to satisfy the domestic demand. The contamination of wheat and other food products with mycotoxins is a major public health issue because of their high toxicity (Gozzi et al., 2024). Research has been carried out globally on mycotoxins to assess their occurrence in various food items and the extent of their severity (Bouelet et al., 2023). Food entities can be severely contaminated by mycotoxins, as some of these toxins are classified as highly carcinogenic by the International Agency of Research on Cancer (IARC). Mycotoxins can have immunosuppressive, teratogenic, and neurotoxic effects on the human body (Latham et al., 2023). Well-known mycotoxins are aflatoxins (AFs), ochratoxins (OTAs), trichothecene or deoxynivalenol (DON), and fumonisins (FUMs) (Agriopoulou et al., 2020; Aloui et al., 2023; Milani, 2013).
In many developing nations, molds grow and spread as a result of a combination of humid environmental conditions and inadequate drying, that is, because of poor pre-harvest and post-harvest conditions (Feldman and Levy, 2023). This leads to unacceptable concentrations of different mycotoxins, especially AFs, in corn, wheat, rice, red chili, tree nuts, turmeric, groundnuts, and various other agricultural products. The presence of mycotoxins in diverse food items has been linked to prolonged health effects, such as instances of cancers and immune deficiency. Currently, numerous mycotoxins have been recognized, which have attracted the attention of scientists because of their severe impacts on human health and presence in food (Patriarca and Pinto, 2017; Sadef et al., 2023).
Fungal species such as Aspergillus and Fusarium, which produce mycotoxins, can develop on various crops and food items (Nazir et al., 2021). They have the ability to penetrate deep into food, rather than being limited to growth on the outer surface. Depending on their types and quantities, mycotoxin contamination can manifest as acute or chronic venoms, even at very low to high doses. Food-borne mycotoxins have adverse effects, which lead to serious illnesses that manifest as acute symptoms shortly after the ingestion of contaminated food. The allowable concentration of AFs in wheat is 4 µg/kg (Nisa et al., 2016). However, according to the European Commission Regulation (EC, 2010) and Codex Alimentarius Commission (2012), the permissible levels for DON, FUMs, and OTAs are, respectively, 1000 µg/kg, 1000 µg/kg, and 5 µg/kg.
It is of utmost importance to create sensitive, rapid, and reproducible methods for identifying the occurrence of considerable mycotoxins in staple crops. The thin layer chromatography (TLC) method can be used for the qualitative analysis of mycotoxins in different food products. It is necessary to validate the method and develop a rapid detection method for mycotoxins. Reliable methods like HPLC and ELISA are extremely useful for quantifying mycotoxins. These tools will undeniably assist the wheat, rice, and corn sectors in identifying mycotoxins for the quality assurance of food commodities (Jaimez et al., 2000; Turner et al., 2015). The present study involves identifying different mycotoxins in wheat collected from local stores in Lahore in the summer and winter seasons. The purpose of this study is to create an awareness about mycotoxin contamination in wheat in local shops that have improper storage. This could help in preventing health hazards.
Materials and Methods
Wheat varieties were chosen for mycotoxin assessment based on their nutritional and economic significance. The following four district types of mycotoxins were chosen for investigation:
-
Total AFs (B1+B2+G1+G2)
-
OTAs (A+B+C)
-
DON (Vomitoxin)
-
FUMs (FB1+FB2+FB3)
Study of seasonal variations
The production of mycotoxins relies on climate, which is considered a primary driving factor in the development of fungi and mycotoxin contamination. From this perspective, nations such as Pakistan are more vulnerable to climatic influences such as temperature changes, drought, flooding, and humidity (Magan et al., 2011). Soil fertilizers, various pesticides, contamination by harmful heavy metals, and numerous potential causes for concern in developing nations are also accountable for mycotoxin contamination. The research was categorized into the following two primary seasonal groups for sample collection:
-
Summer/humid/rainy seasons: When temperature may rise from 25ºC to as high as 45°C.
-
Winter/foggy/meek weather: Temperature may go down from 20ºC to 4°C.
Lahore is situated on the western side of the flat floodplain along the River Ravi. Lahore is located at a longitude range of 74°-01’ to 74°-39’ east and a latitude range of 31°-15’ to 31°-42’ north. It is the second largest and the second most densely populated district in Pakistan (Rana and Bhatti, 2018). The average range of the lowest and highest temperatures throughout the year were from 5.9°C to 22°C. The summer season has lower relative humidity compared to the winter season. The months of April, May, and June are extremely hot and arid in Lahore, often accompanied by dust storms. The monsoon season begins in late June or early July, bringing humid and muggy conditions along with intense rainstorms. In Lahore, July, August, and September are primarily hot and humid. Cold and dry conditions persist from October to March (Khan et al., 2021).
Collection of samples
The Lahore district has been chosen for wheat collection because of its high consumption in this region of Punjab, Pakistan. Twenty wheat samples (n=20) were obtained from local stores in Lahore, where the storage conditions were observed to be extremely inadequate and unhygienic. Ten samples were collected during summer and ten during winter. All samples were collected by assessing their physical characteristics, storage environments, hygiene, and contamination. The temperature recorded during sample collection ranged from 25 to 40ºC in summer and 13 to 22ºC in winter, with humidity levels at 45–69% in summer and 40–55% in winter. Since mycotoxins are not evenly distributed and wheat grains can contain areas with elevated levels of mycotoxins, an appropriate sampling strategy was implemented. The sampling method outlined in AOAC no. 977.16 was adhered to (Trucksess, 2005). A 1 kg sample was obtained using a probe from two to three different diagonal locations within the container. Subsequently, the gathered wheat samples were processed through a sample divider to 200 g after thoroughly homogenizing the sample. Each sample was once more thoroughly mixed and ground into a fine powder prior to analysis (Nisa et al., 2016; Yi et al., 2022).
Storage conditions
The wheat samples were stored in airtight polyethylene bags and kept at 4°C prior to analysis (Cheng et al., 2022).
Chemicals used in the study
All chemicals utilized in the current study were of analytical grade. Acetonitrile (sourced from Merck, Darmstadt, Germany) was used for the extraction of mycotoxins and also as a mobile phase.
Preparation of standard solutions
Various stock solutions for AFs (50 μg/kg), OTA (25 μg/kg), DON (6 mg/kg), and FUMs (6 mg/kg) were freshly prepared. The corresponding standards were diluted in a mixture of acetonitrile and water (20:80, v/v) and kept at −20°C (Irakli et al., 2017).
Specifications of equipment
The Agilent 1200 system (Agilent Technologies, Urdorf, Switzerland) employed reversed phase-HPLC for quantifying various mycotoxins. The HPLC was outfitted with a Rheodyne injector valve (Irakli et al., 2017) featuring a 20 µL loop and a pump. The diode array and fluorescent detectors were linked in series within the HPLC setup. Agilent Chemstation Software of Agilent Technologies, version B.04.01 was utilized for the capture and assessment of various chromatograms.
Protocol followed
Multiple mycotoxins were analyzed in wheat samples using HPLC equipped with a diode array detector (DAD). One kilogram of every wheat sample was collected and mixed thoroughly (Santos et al., 2022) for homogenizing the sample. The sample was crushed in a grinding mill (Romer Labs). A conical flask received 5 g of the homogenized ground wheat sample, to which 50 mL of 70% acetonitrile was added. The sample solution was agitated on a shaker for 30 min. The sample solution underwent filtration, and the collected extract was filtered again using filter paper (Whatman 4). The sample extracts were subsequently filtered one more time using 0.5-micron syringe filters prior to injection into the HPLC C18 column. Twenty microliters of the extract was injected into the HPLC system. The mobile phase employed consisted of acetonitrile: water (45:55 v/v). The flow rate was 1 mL/min with a duration of 15 min. The excitation and emission wavelengths were 254 nm and 460 nm, respectively.
Statistical analysis
IBM Statistics Version 22.0 was utilized for the statistical evaluation of mycotoxins in wheat (Zahra et al., 2017). Mean and standard deviation were also calculated through descriptive analysis. A one-way analysis of variance (ANOVA) at α = 0.05 was conducted to assess the impact of seasons on levels of mycotoxin in wheat samples collected from local stores in Lahore, Pakistan.
Results and Discussion
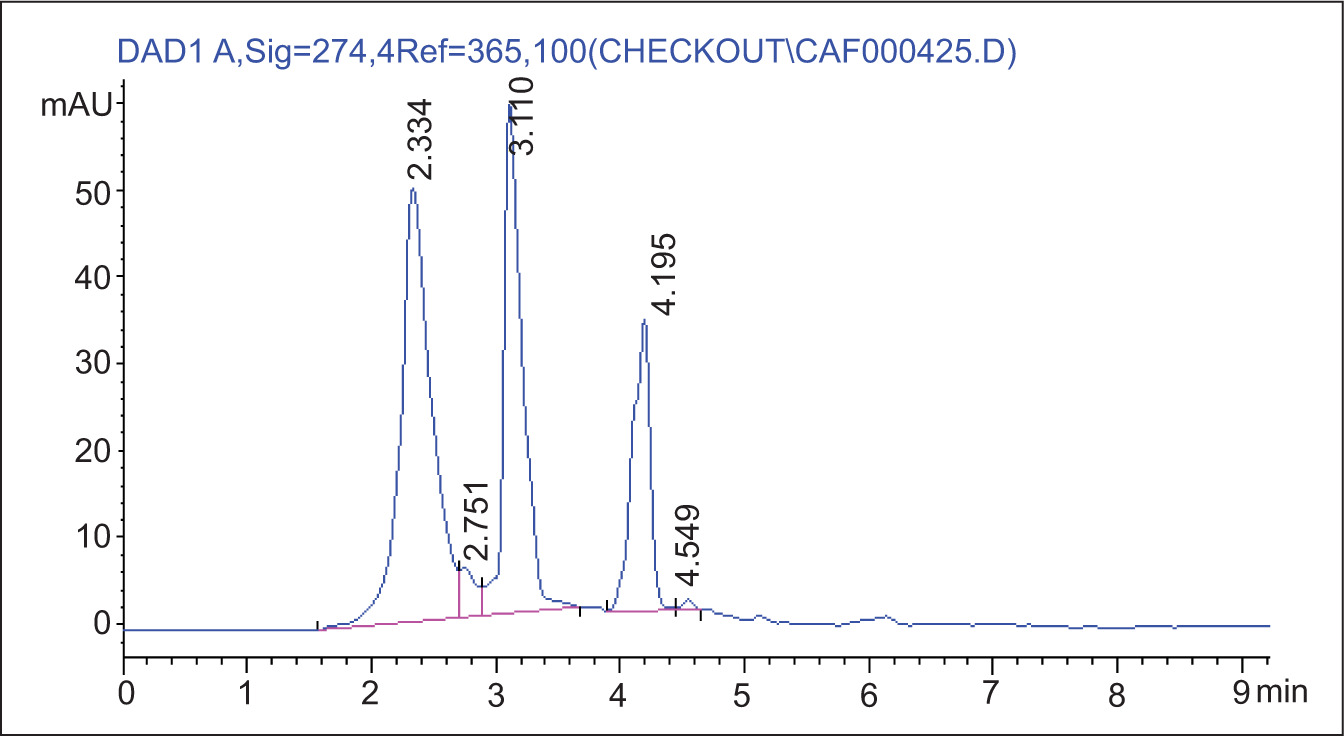
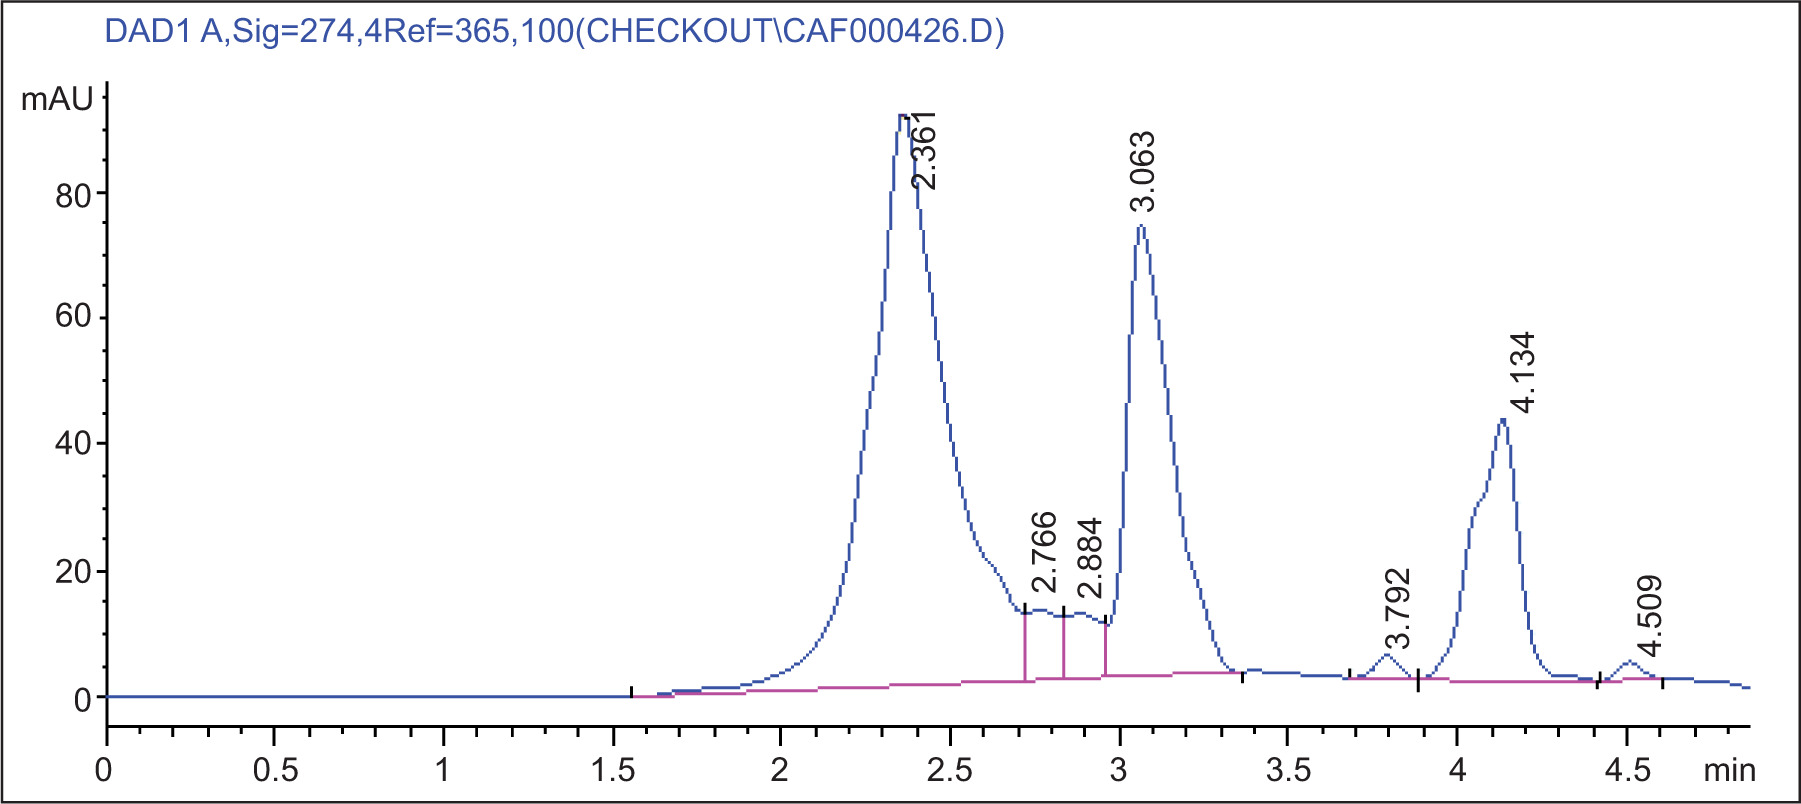
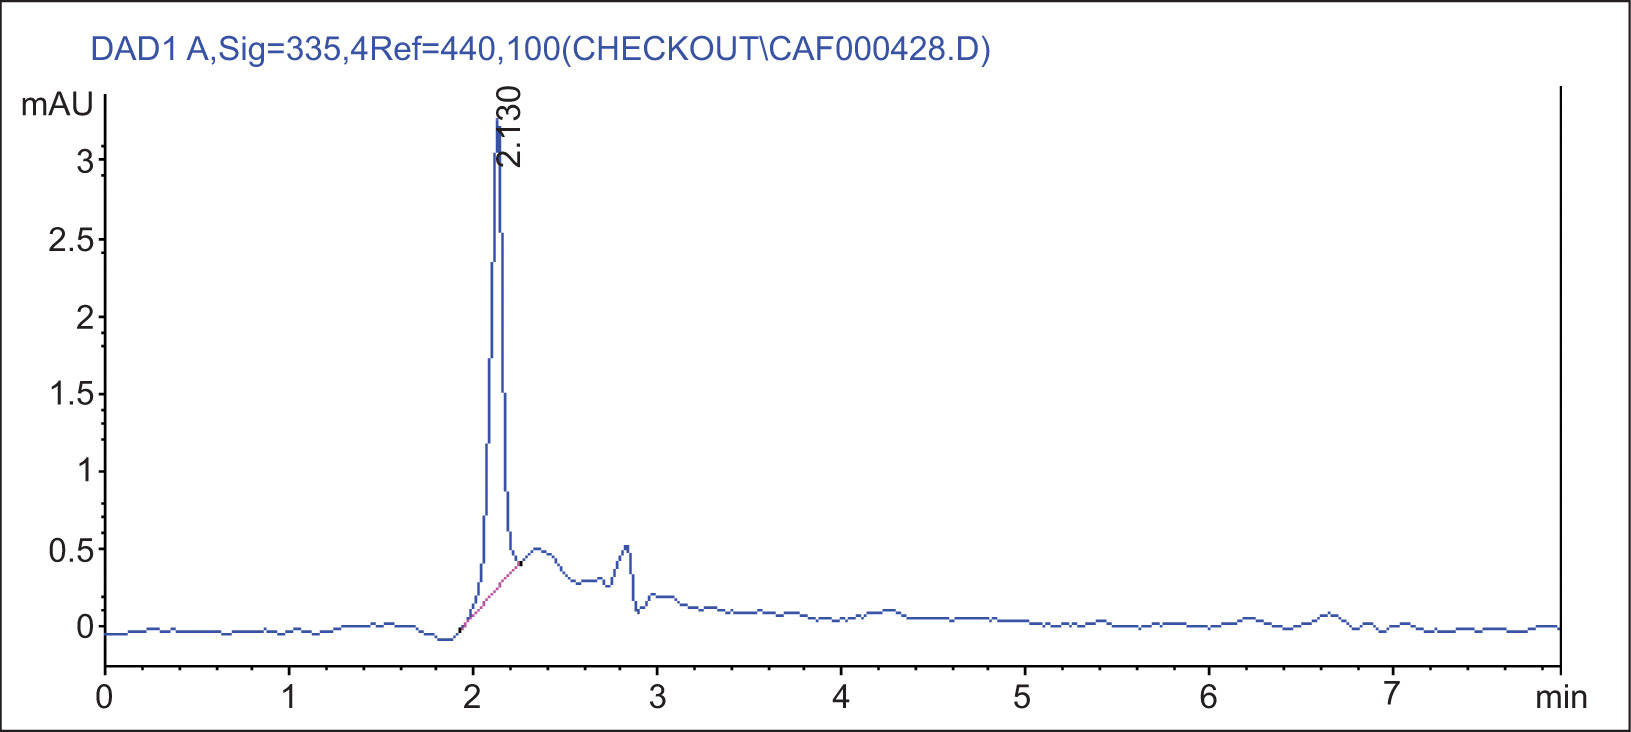
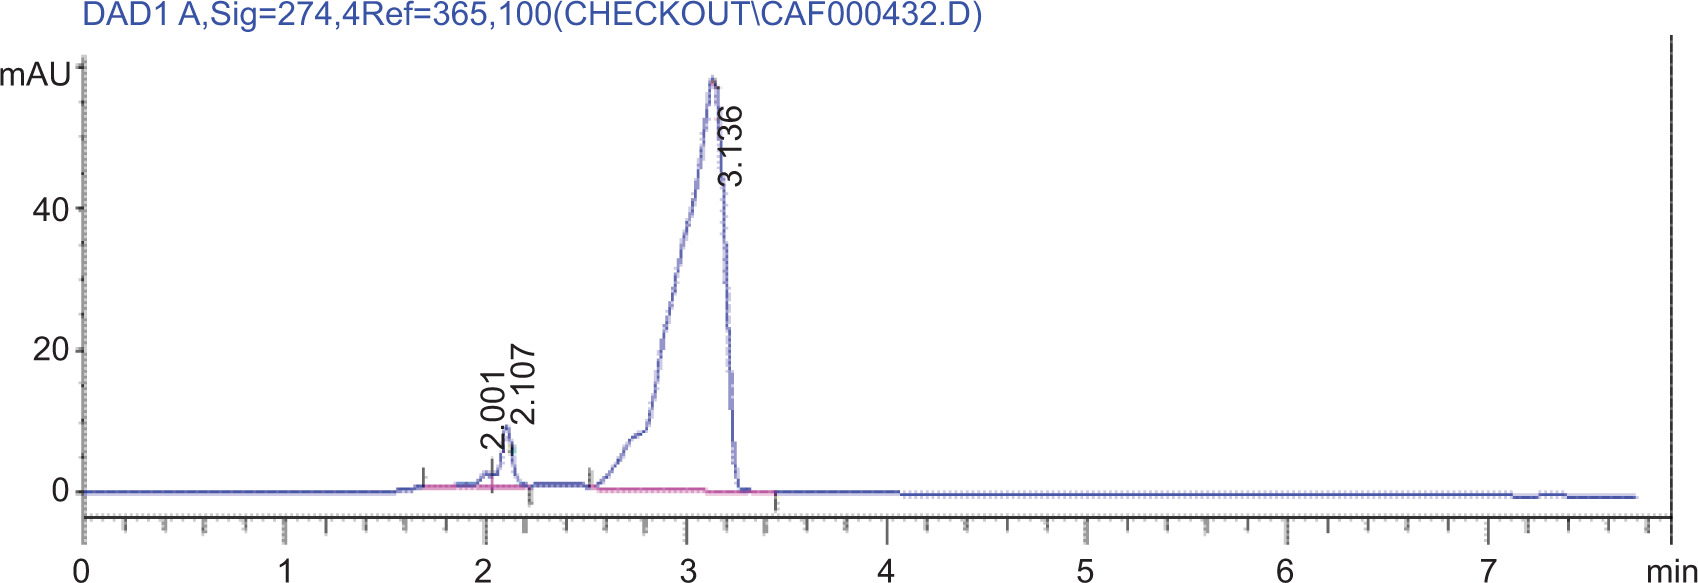
Wheat is widely used as a key ingredient in various food items such as cakes, biscuits, and breads. Various wheat-based food items can become contaminated with mycotoxins, compromising the quality of these products (Hedayati et al., 2016). Various mycotoxins in wheat were measured to assess the highest level of contamination. Mycotoxins (AFs, OTAs, DON, and FUMs) were measured through HPLC. The chromatograms for various mycotoxins are presented in Figures 1–4.
Figure 1. Aflatoxins HPLC chromatogram.
Figure 2. Ochratoxins HPLC chromatogram.
Figure 3. Deoxynivalenol HPLC chromatogram.
Figure 4. Fumonisins HPLC chromatogram.
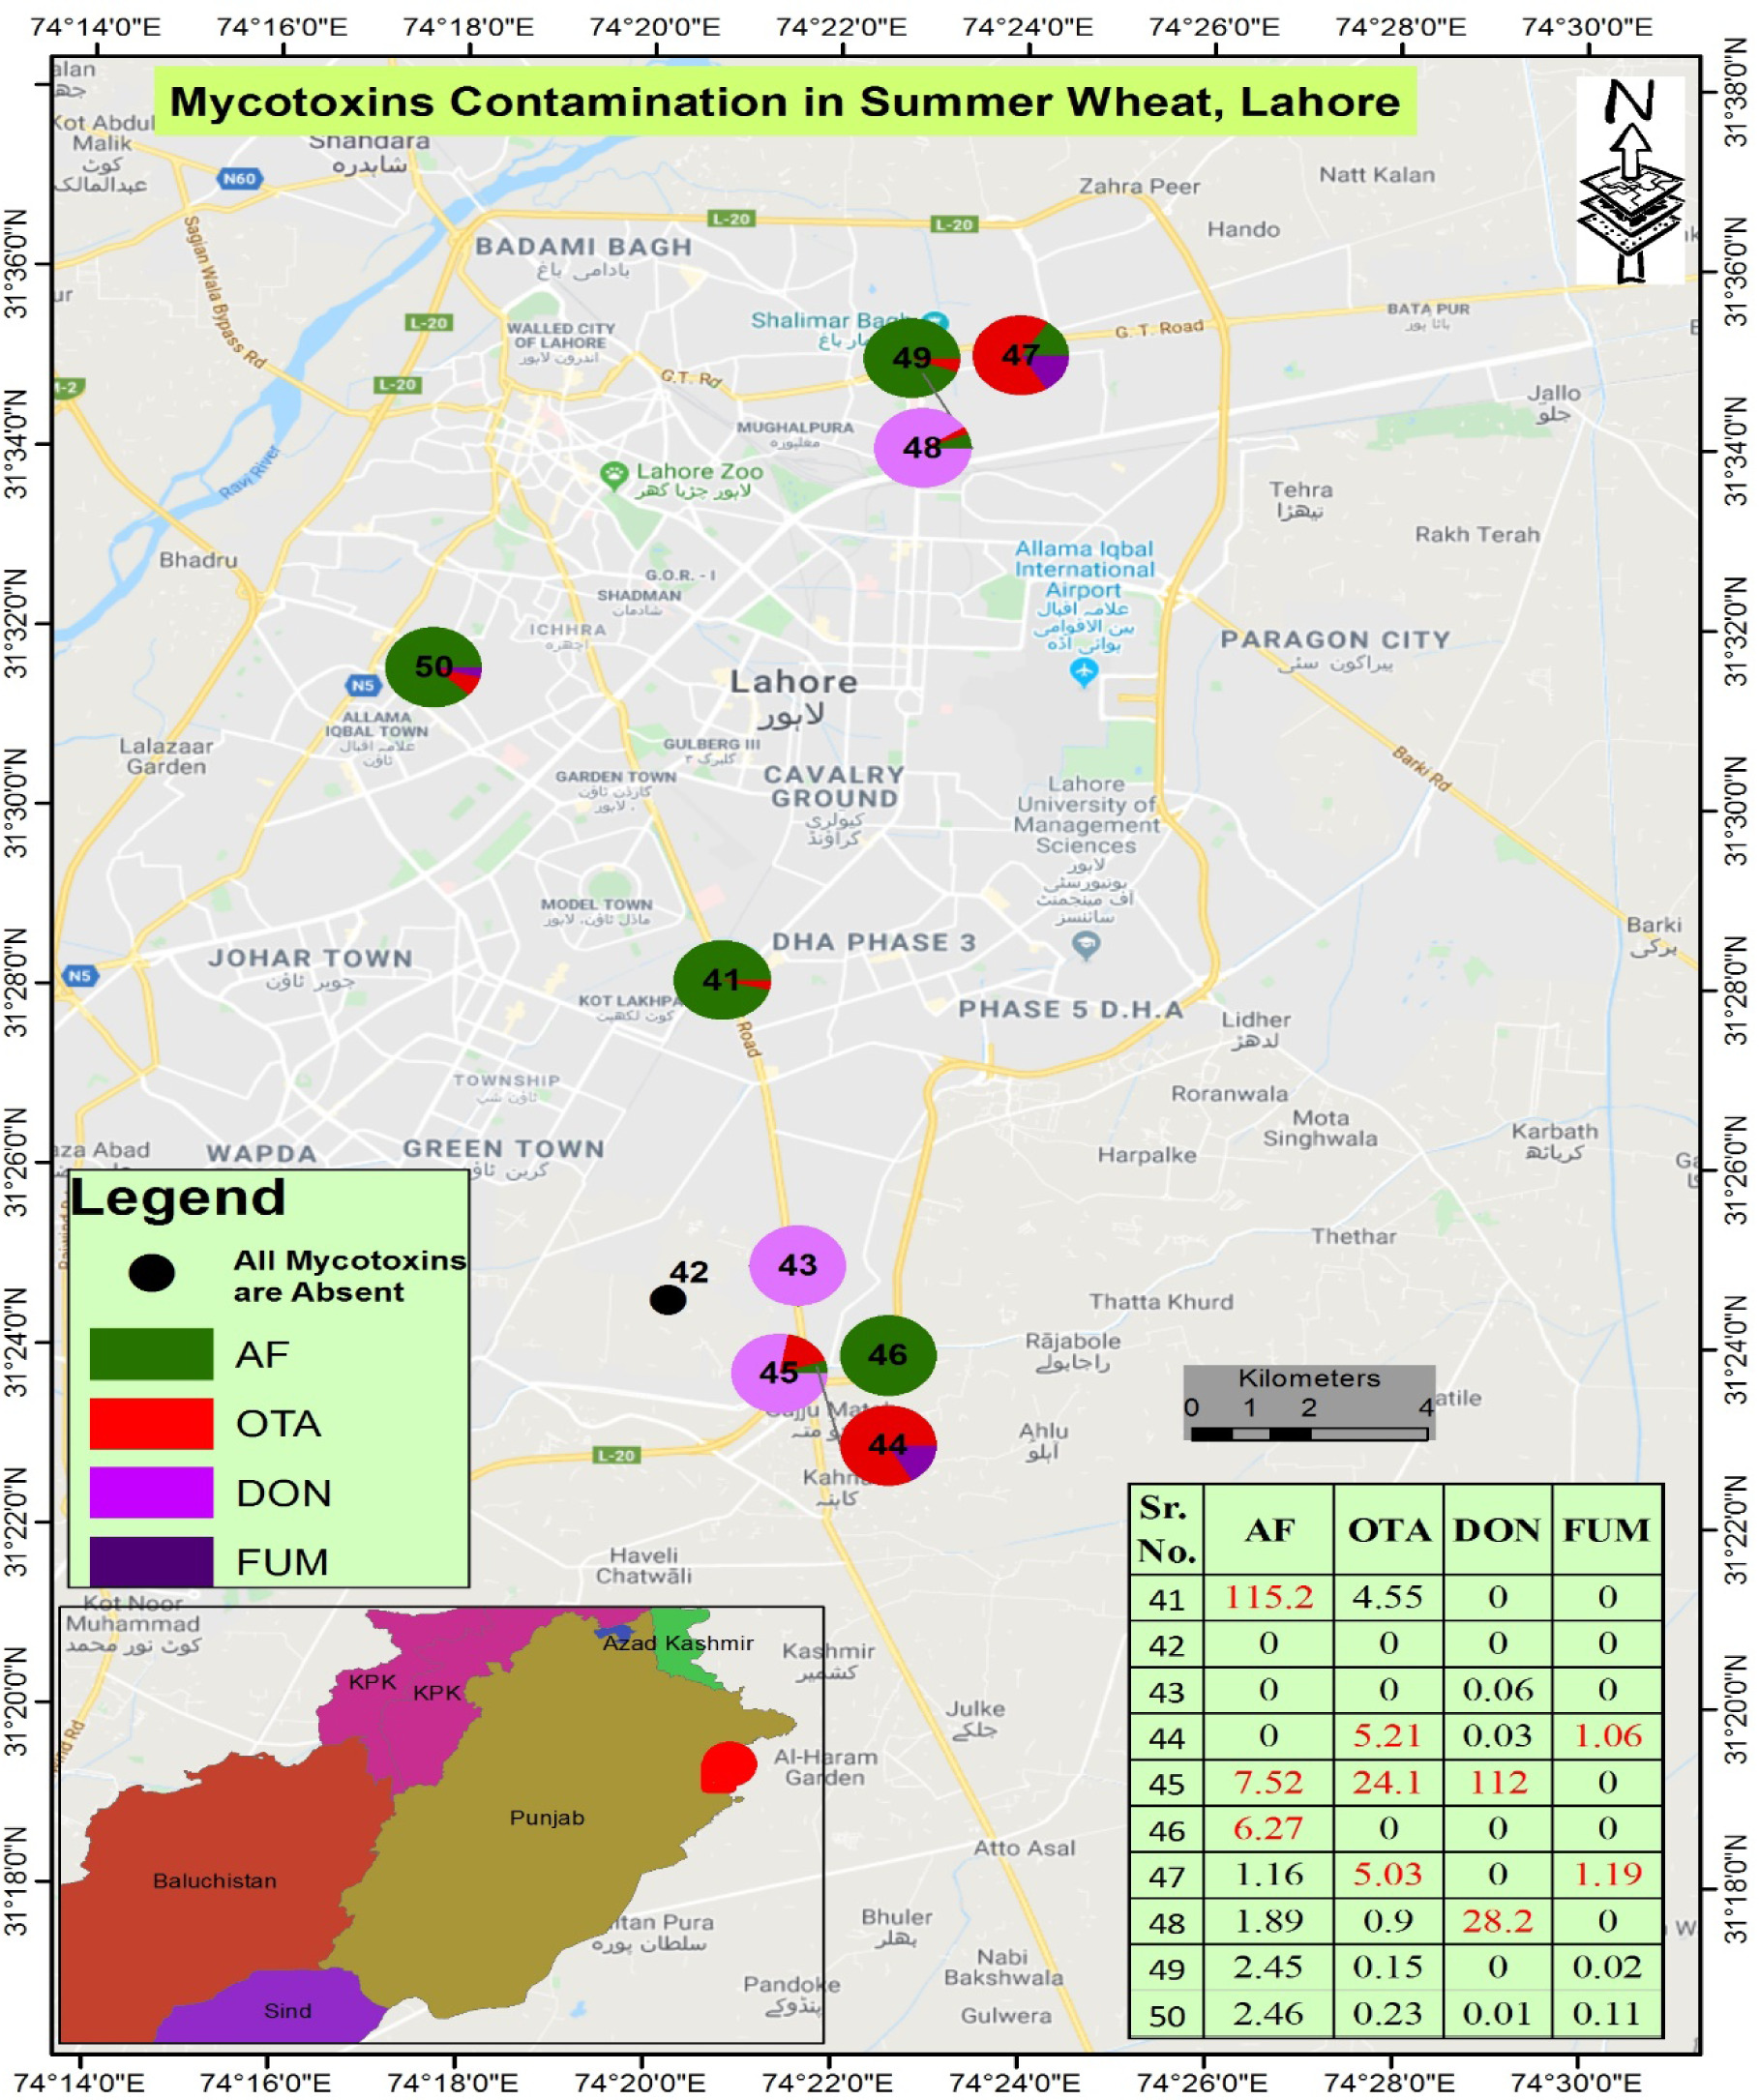
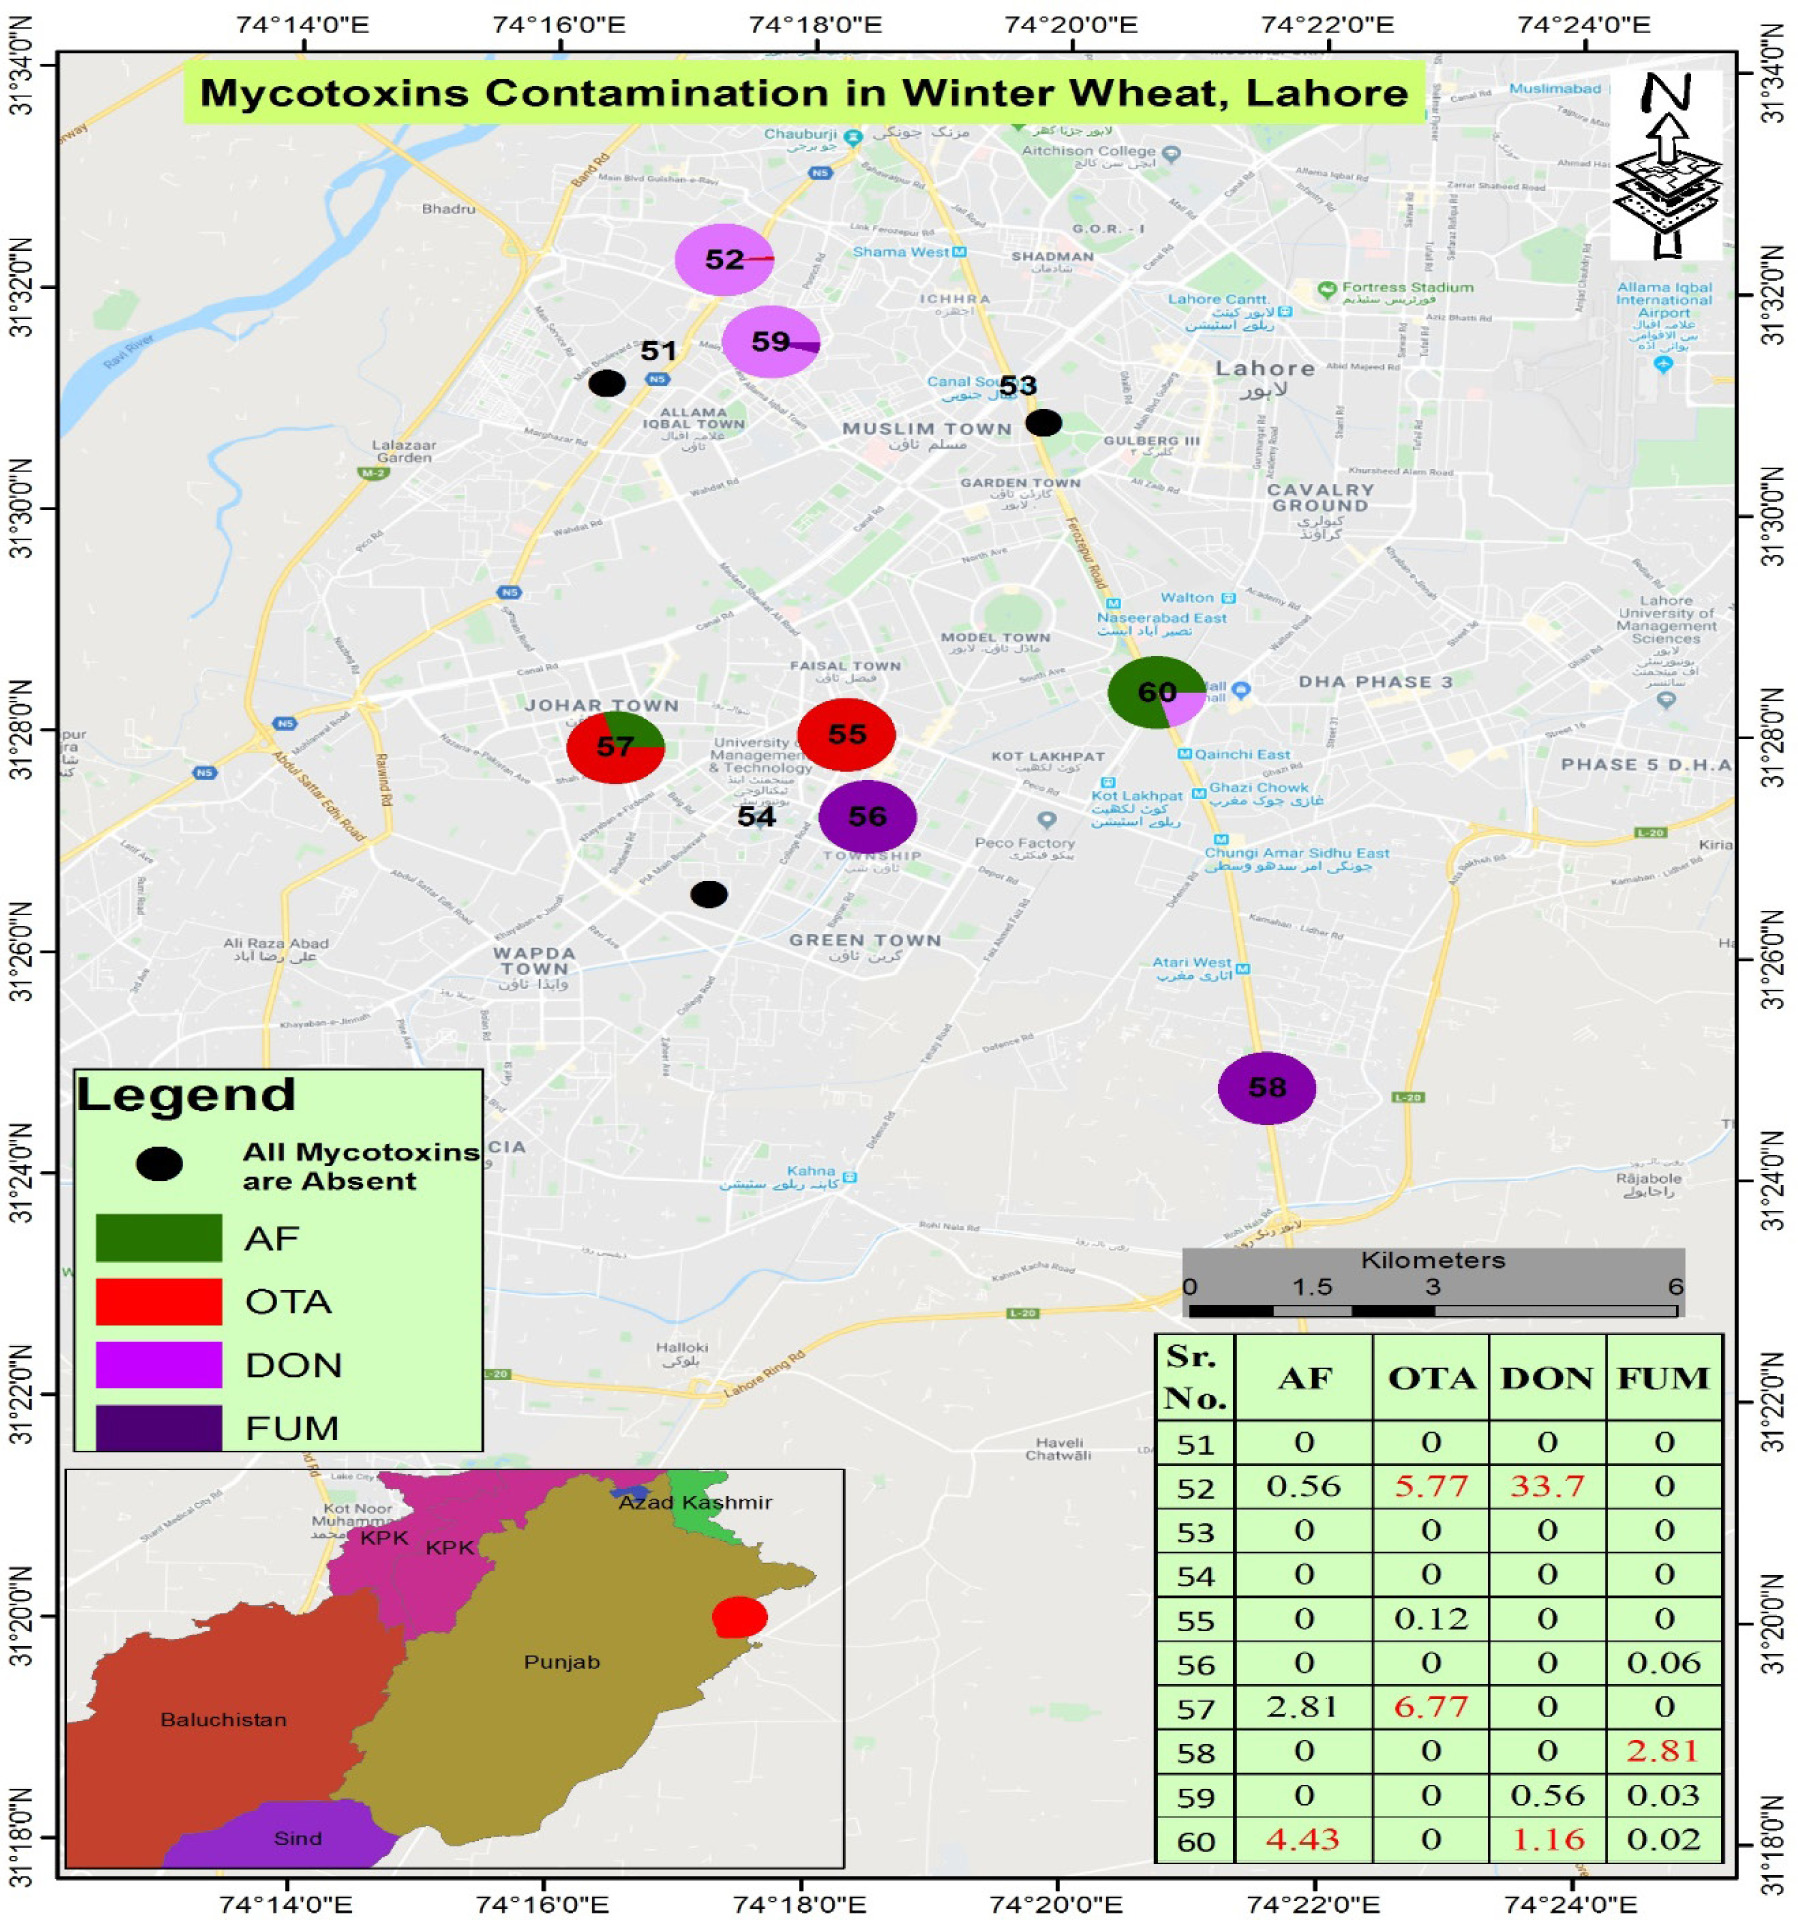
Contamination levels of total AFs, OTA, DON, and FUMs in wheat samples collected from Lahore were recorded at 0.56–115.19 μg/Kg, 0.12–24.13 μg/kg, 0.01–112.00 mg/kg, and 0.02–2.81mg/kg, respectively (Table 1).
Table 1. Contamination of mycotoxins in wheat samples collected from Lahore.
| Sr. No. | Sample No. | AFs (μg/kg) + SD | OTA (μg/kg) + SD | DON (mg/kg) + SD | FUM (mg/kg) + SD |
|---|---|---|---|---|---|
| Summer Samples | |||||
| 1. | Whe-S-51 | 115.19±8.67 | 4.55±1.51 | ND | ND |
| 2. | Whe-S-52 | ND | ND | ND | ND |
| 3. | Whe-S-53 | ND | ND | 0.06±0.03 | ND |
| 4. | Whe-S-54 | ND | 5.21±1.54 | 0.03±0.01 | 1.06±0.04 |
| 5. | Whe-S-55 | 7.52±0.27 | 24.13±4.61 | 112.00±2.64 | ND |
| 6. | Whe-S-56 | 6.27±0.36 | ND | ND | ND |
| 7. | Whe-S-57 | 1.16±0.11 | 5.03±1.11 | ND | 1.19±0.51 |
| 8. | Whe-S-58 | 1.89±0.83 | 0.90±0.21 | 28.16±2.48 | ND |
| 9. | Whe-S-59 | 2.45±0.65 | 0.15±0.06 | ND | 0.02±0.01 |
| 10. | Whe-S-60 | 2.46±0.14 | 0.23±0.07 | 0.01±0.01 | 0.11±0.01 |
| Winter Samples | |||||
| 11. | Whe-W-61 | ND | ND | ND | ND |
| 12. | Whe-W-62 | 0.56±0.26 | 5.77±0.33 | 33.69±5.68 | ND |
| 13. | Whe-W-63 | ND | ND | ND | ND |
| 14. | Whe-W-64 | ND | ND | ND | ND |
| 15. | Whe-W-65 | ND | 0.12±0.08 | ND | ND |
| 16. | Whe-W-66 | ND | ND | ND | 0.06±0.1 |
| 17. | Whe-W-67 | 2.81±0.12 | 6.77±0.14 | ND | ND |
| 18. | Whe-W-68 | ND | ND | ND | 2.81±0.44 |
| 19. | Whe-W-69 | ND | ND | 0.56±0.10 | 0.03±0.02 |
| 20. | Whe-W-70 | 4.43±0.50 | ND | 1.16±0.31 | 0.02±0.02 |
ND= Not detected.
The concentration of mycotoxins satisfied the assumptions of one-way ANOVA. Levene’s test confirmed that the homogeneity of variances was satisfied (Table 2) and indicated that the data are significant for AFs across two seasons. For OTA and DON, it is again notable, whereas for FUM it is not noteworthy.
Table 2. Test of homogeneity of variances.
| Levene statistic | df1 | df2 | Sig. | |
|---|---|---|---|---|
| AF | 14.296 | 1 | 58 | 0.000 |
| OTA | 6.359 | 1 | 58 | 0.014 |
| DON | 11.099 | 1 | 58 | 0.002 |
| FUM | 1.149 | 1 | 58 | 0.288 |
The outcomes of the ANOVA are presented in Table 3. ANOVA indicated a significant difference among groups with p = 0.046, whereas for OTA, DON, and FUM, the results are nonsignificant. While elevated temperature and humidity are crucial for mycotoxin production, some samples were found to be contaminated during winter at levels exceeding permissible limits because of inadequate storage conditions (Taheri et al., 2012).
Table 3. ANOVA results of mycotoxins.
| Sum of squares | Df | Mean square | F | Sig. | ||
|---|---|---|---|---|---|---|
| AF | Between Groups | 2501.829 | 1 | 2501.829 | 4.177 | 0.046 |
| Within Groups | 34738.008 | 58 | 598.931 | |||
| Total | 37239.837 | 59 | ||||
| OTA | Between Groups | 113.823 | 1 | 113.823 | 3.811 | 0.056 |
| Within Groups | 1732.061 | 58 | 29.863 | |||
| Total | 1845.884 | 59 | ||||
| DON | Between Groups | 1648.965 | 1 | 1648.965 | 2.569 | 0.114 |
| Within Groups | 37234.147 | 58 | 641.968 | |||
| Total | 38883.112 | 59 | ||||
| FUM | Between Groups | 0.042 | 1 | 0.042 | 0.088 | 0.768 |
| Within Groups | 28.068 | 58 | 0.484 | |||
| Total | 28.110 | 59 |
Descriptive analysis showed that in summer 115.19 μg/kg AF, 24.13 μg/kg OTA, 112.00 mg/kg DON, and 1.19 mg/kg FUM were present in wheat as maximum concentration while in winter 4.43 μg/kg AF, 6.77 μg/kg OTA, 33.69 mg/kg DON, and 2.81 mg/kg FUM were present in wheat as maximum concentration.
Lutfullah and Hussain (2012) examined the levels of AF contamination in various cereals in Pakistan. Maize samples exhibited the highest contamination at 18.5μg/kg, while wheat, barley, rice, sorghum, and broken rice showed contamination levels of 15.5μg/kg, 12.6μg/kg, 10.8μg/kg, 9.4μg/kg, and 8μg/kg, respectively. Various studies globally have reported the determination of multiple mycotoxins in wheat. In two different studies performed in China, researchers discovered DON, Afs, and FUMs in concentrations of 221.4 μg/kg, 0.1–0.8 μg/kg, and 0–400 μg/kg, respectively (Sun et al., 2011; Sun and Wu, 2016). In similar research carried out in Nigeria by Ezekiel and Sombie (2014), the levels of AFs in analyzed snacks were found. The levels of AF contamination ranged from 0.8 to 3.5 ppb in all selected food samples. In wheat-based pastas, 1.2 ppb of mean AFs were found.
A study in Mazandaran Province, Iran, analyzed 118 wheat samples for the quantification of various Aspergillus species and discovered a 64.6% contamination rate of Aspergillus flavus. According to FAO/UNICEF/WHO and the Standard Administration of Iran, the allowable limit for AFs in wheat is 30 μg/kg (Feyzi et al., 2017). AF B1 and G1 were detected at approximately 2.54% and 3.39%, with averages of 1.53 and 2.75 μg/kg, respectively. The highest level of contamination detected in wheat was 7.10 μg/kg.
The overall findings indicated that the samples gathered in the summer season exhibited higher levels of contamination compared to those collected in winter (Figures 5 and 6). Six samples of summer wheat and four from winter were found to have mycotoxin contamination exceeding acceptable limits. In wheat from the Lahore district, contamination levels of AFs, OTA, DON, and FUMs were found to be 55%, 45%, 40%, and 40%, respectively, while 20%, 25%, 20%, and 15% of the samples exceeded permissible limits for AFs, OTA, DON, and FUMs, respectively (Table 4).
Figure 5. Mycotoxin contamination in wheat samples collected from the Lahore district during the summer season.
Figure 6. Mycotoxin contamination in wheat samples collected from the Lahore district during the winter season.
Table 4. Number of samples beyond the highest levels for mycotoxins in wheat as established by the European Union.
| Area | Aflatoxins Contaminated Samples (%) | Aflatoxins Contaminated Samples beyond permissible levels (%) in total samples | Ochratoxin Contaminated Samples (%) | Ochratoxins Contaminated Samples beyond permissible levels (%) in total samples | Deoxynivalenol Contaminated Samples (%) | Deoxynivalenol Contaminated Samples beyond permissible levels (%) in total samples | Fumonisins Contaminated Samples (%) | Fumonisins Contaminated Samples beyond permissible levels (%) in total samples |
|---|---|---|---|---|---|---|---|---|
| District Lahore | 55 | 20 | 45 | 25 | 40 | 20 | 40 | 15 |
In Pakistan, a comparable study was carried out by Majeed (2018), in which n=124 wheat samples were gathered from the Punjab Province. Wheat samples contained multiple mycotoxins. The contamination percentages were determined to be 43% AFB1, 41% AFB2, 11% OTA, 21% DON, along with 29% FB1, 18% FB2, and 12% FB3. AF was identified as the most common toxin in wheat, a finding that aligns with the current study. Likewise, a study on AF contamination in wheat kernels was conducted (Asghar et al., 2016), revealing 26% AFB1 and 7% AFB2 contamination in wheat samples. In total, just 2.7% of AFs in wheat exceeded the allowable levels. The contamination percentage of wheat with mycotoxins in the current study is elevated compared to both investigations, potentially because the samples were taken from shops with very inadequate storage conditions.
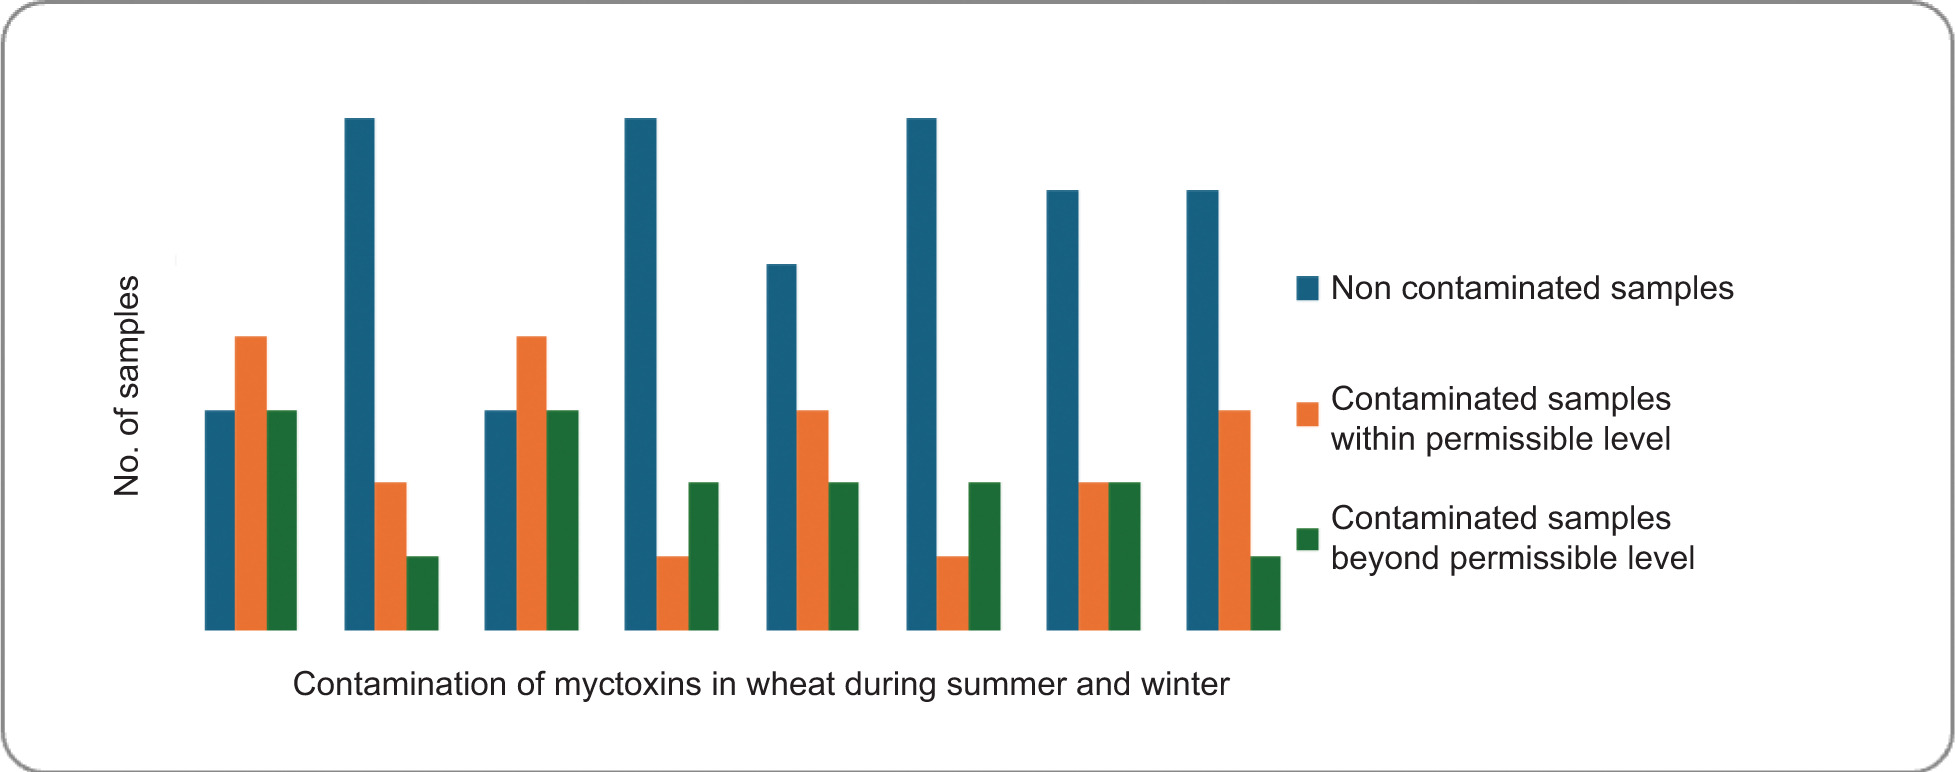
The season may greatly affect fungal growth as it is clear from the study that wheat samples collected in summer are more contaminated with mycotoxins than the wheat samples collected in winter (Figure 7). In a study, it was found that higher temperatures from 20 to 40ºC are favorable for toxin production (Sousa et al., 2019) while toxin production was minimum at 5ºC. The present study is in accordance with the reported work as contagion of mycotoxins was more in summer than in winter. In another study on feed, the effect of temperature on Aspergillus flavus production was studied, and it was found that in high temperature months, the incidence ranged between 66 and 93% while in cold temperature months, it reduced to 40%. High temperature and moisture may increase fungal contamination (Asif M, 2024; Iram et al., 2019; Tittlemier, et al., 2025).
Figure 7. Presence of mycotoxins in wheat during different seasons.
Wheat consumption is increasing day by day because of the increase in population. This research was basically conducted to check the presence of multiple mycotoxins in wheat available in local shops. The results were discouarging as 10 out of 20 samples were contaminated beyond permissible levels and were declared as unfit on the basis of one toxin beyond acceptable range.
Conclusion
The presence of mycotoxins in different food commodities needs attention as the incidence of liver cancer, allergies, stomach ulcers, etc., is on the rise. Improper handling, poor storage facilities, and adverse environmental conditions may contaminate food entities with various mycotoxins. The dire necessity to protect food commodities has prompted all countries to pay attention to contamination by mycotoxins in different food entities. Wheat and wheat products are among the major crops of Punjab, Pakistan. Special attention is required to avoid mycotoxin contamination in these products before exporting them. Overall, 20%, 25%, 20%, and 15% of wheat samples were contaminated with AFs, OTA, DON, and FUM, respectively, and were unfit according to EU permissible levels for human consumption because of the presence of multiple mycotoxins in wheat samples. Six samples in the summer season and four samples in the winter season were infected with mycotoxins beyond acceptable limits. This is because warm temperature may increase fungal growth. High temperature and high humidity are favorable conditions for the growth of mycotoxins. Five out of 20 (25%) samples were contaminated with multiple mycotoxins. The presence of high levels of mycotoxins in wheat samples is highly alarming. Proper handling, suitable environmental conditions, and careful storage can reduce the chances of mycotoxin contamination in wheat and wheat products. Inspection on a constant basis is needed to detect any hazardous and dangerous health circumstances. The awareness must be given to farmers and people to inspect the quality of wheat and wheat products in order to avoid mycotoxin contamination.
Acknowledgement
The authors would like to thank the Headship of PCSIR Laboratories, Lahore, and Kinnaird College, Lahore, for providing Technical Support. The authors express their gratitude to Princess Nourah bint Abdulrahman University Researchers Supporting Project number (PNURSP2025R890), Princess Nourah bint Abdulrahman University, Riyadh, Saudi Arabia. The authors also thank the Deanship of Scientific Research (DSR) at King Faisal University under project no. [KFU251499].
Authors Contributions
Conceptualization, Naseem Zahra; methodology, Nadia Jamil; software, Muhammad Khalid Saeed; validation, Rania Ali El Hadi Mohamed and Fakhria A. Al-Joufi; formal analysis, Asif Javed; investigation, Najeeb Ullah; resources, Tariq Aziz; data curation, Nadeem Ullah.; writing—original draft preparation, Fahad Al-Asmari.; writing—review and editing, Tariq Aziz; visualization, Abid Sarwar; supervision, Tariq Aziz.; project administration, Naseem Zahra; funding acquisition, Tariq Aziz.
Conflict of Interest
All authors declare no conflict of interest.
REFERENCES
Agriopoulou S., Stamatelopoulou E., Varzakas T. 2020. Advances in occurrence, importance, and mycotoxin control strategies: Prevention and detoxification in foods. Foods. 9(2): 137–184. 10.3390/foods9020137
Aloui A., Salah-Abbès J.B., Zinedine A., Meile J.C., Riba A., Durand N., Montet D., Abbès S., Brabet C. 2023. Occurrence of pre-and postharvest multi-mycotoxins in durum wheat grains collected in 2020 and 2021 in two climatic regions of Tunisia. Food Addit. Contam. B. 16(3): 274–287. 10.1080/19393210.2023.2219996
Asghar M.A., Ahmed A., Iqbal J., Zahir E., Nauman H. 2016. Fungal flora and aflatoxin contamination in Pakistani wheat kernels (Triticum aestivum L.) and their attribution in seed germination. JFDA. 24(3): 635–643. 10.1016/j.jfda.2016.02.001
Asif I. 2024. Welfare Implications of High Wheat Prices on Heterogeneous Households in Pakistan (Doctoral dissertation, School of Social Sciences and Humanities (S3H) NUST).
Asif M. 2024. Effects of Cultivars and Fungicides on Foliar Fungal Diseases and Fusarium Head Blight in Winter Wheat (Doctoral dissertation, The University of Nebraska-Lincoln).
Bouelet Ntsama I.S., Frazzoli C., Pouokam G.B., Colizzi V. 2023. Occurrence and dietary risk assessment of mycotoxins in most consumed foods in Cameroon: Exploring current data to understand futures challenges. Foods. 12(8): 1713. 10.3390/foods12081713
Cheng S., Feng X., Liu G., Zhao N., Liu J., Zhang Z., Liu Y. 2022. Natural occurrence of mycotoxins in maize in north China. Toxins. 14(8): 521. 10.3390/toxins14080521
Codex Alimentarius Commission. 2012. Maximum residue limits for veterinary drugs in foods. Updated as at the 35th Session of the Codex Alimentarius Commission, CAC/MRL, 1–40.
European Commission Regulation, EC. 2006. Regulation (EC) No. 1881/2006 of 19 December 2006 setting maximum levels for certain contaminants in foodstuffs. OJEU. L364: 5e24.
European Commission Regulation, EC (2010). EC No. 165/2010 of 26 February 2010, Amending regulation (EC) No 1881/2006. Setting maximum levels for certain contaminants in foodstuffs as regards aflatoxins. OJEU. L50: 8–12.
Ezekiel C.N., and Sombie J.I. 2014. Survey of aflatoxins and fungi in some commercial breakfast cereals and pastas retailed in Ogun State, Nigeria. Nat. Sci. 12(6): 27–32. http://www.sciencepub.net/nature.
Feldman M., and Levy A.A. 2023. Evolution of wheat under cultivation. In Wheat Evolution and Domestication (pp. 605–663). Cham: Springer International Publishing. 10.1007/978-3-031-30175-9_13
Gozzi M., Blandino M., Bruni R., Capo L., Righetti L., Dall’Asta C. 2024. Mycotoxin occurrence in kernels and straws of wheat, barley, and tritordeum. Mycotoxin Res. 40(1): 203–210. 10.1007/s12550-024-00521-w
Feyzi Y., Malekirad A., Fazilati M., Salavati H., Habibollahi S., Rezaei M. 2017. Metals that are important for food safety control of bread Product. ABR. 258:S163–S164. 10.15515/abr.0976-4585.8.1.111116
Hedayati M.T., Omran S.M., Soleymani A., Armaki M.T. 2016. Aflatoxins in food products in Iran: A review of the literature. JJM. 9(7): e33235. 10.5812/jjm.33235
Iqbal S.Z., Asi M.R., Jinap S. 2013. Natural occurrence of aflatoxin B1 and aflatoxin M1 in “halva” and its ingredients. Food Control. 34(2): 404–407. 10.1016/j.foodcont.2013.04.038
Irakli M.N., Skendi A., Papageorgiou M.D. 2017. HPLC-DAD-FLD method for simultaneous determination of mycotoxins in wheat bran. J. Chromatogr. Sci. 55(7): 690–696. 10.1093/chromsci/bmx022
Iram S., Fareed S.K., Chaudhary M., Nisa Iqbal M.U., Ghani R., Khan T.A., Abbas T. 2019. Identification of Aspergillus flavus and aflatoxin in home mix layer poultry feed in relation to seasons in Karachi, Pakistan. Tropical animal health and production, 51, 1321–1327. 10.1007/s11250-019-01818-0
Jaimez J., Fente C.A., Vazquez B.I., Franco C.M., Cepeda A., Mahuzier G., Prognon P. 2000. Application of the assay of aflatoxins by liquid chromatography with fluorescence detection in food analysis. J. Chromatogr. A. 882(1–2): 1–10. 10.1016/S0021-9673(00)00212-0
Khan S., Shahab S., Fani M.I., Wahid A, Khan A. 2021. Climate and weather condition of Balochistan province. Pakistan. Int. J. Econ. Environ. Geol. 12(2): 65–71. 10.46660/ijeeg.v12i2.104
Latham R.L., Boyle J.T., Barbano A., Loveman W.G., Brown N.A. 2023. Diverse mycotoxin threats to safe food and feed cereals. Essays Biochem. 67(5): 797–809. 10.1042/EBC20220221
Lutfullah G., and Hussain A. 2012. Studies on contamination level of aflatoxins in some cereals and beans of Pakistan. Food Control. 23(1): 32–36. 10.1016/j.foodcont.2011.06.004
Magan N., Medina A., Aldred D. 2011. Possible climate-change effects on mycotoxin contamination of food crops pre-and postharvest. Plant Pathol. 60(1): 150–163. 10.1111/j.1365-3059.2010.02412.x
Majeed S. 2018. Analysis, inhibition and degradation of mycotoxins in foodstuffs (Doctoral dissertation, Department of Biotechnology Pakistan Institute of Engineering and Applied Sciences Nilore, Islamabad, Pakistan).
Milani J.M. 2013. Ecological conditions affecting mycotoxin production in cereals: A review. Veterinarni Medicina. 58(8): 405–411. 10.17221/6979-VETMED
Nada S., Nikola T., Bozidar U., Ilija D., Andreja R. 2022. Prevention and practical strategies to control mycotoxins in the wheat and maize chain. Food Control. 136: 108855. 10.1016/j.foodcont.2022.108855
Nazir A., Kalim I., Imran M., Bilal M.A., Zahra N., Ahmad A., Ehtisham-ul-Haque S. 2021. Incidences and bio-detoxification of aflatoxins in rice and cattle feed crops under different agro-ecological zones. Pol. J. Environ. Stud. 30(2): 1949–1954. 10.15244/pjoes/121050
Nisa A., Zahra N., Yasha N.B. 2016. Comparative study of aflatoxins in brown rice samples of local and import quality. Int. Food Res. J. 23(1): 243. http://www.ifrj.upm.edu.my
Patriarca A., and Pinto V.F. 2017. Prevalence of mycotoxins in foods and decontamination. Curr. Opin. Food Sci. 14: 50–60. 10.1016/j.cofs.2017.01.0112214-7993/ã
Rana I.A., and Bhatti S.S. 2018. Lahore, Pakistan–Urbanization challenges and opportunities. Cities. 72: 348–355. 10.1016/j.cities.2017.09.014
Sadef Y., Shakil S., Majeed D., Zahra N., Abdallah F.B., Ali M.B. 2023. Evaluating aflatoxins and Sudan dyes contamination in red chili and turmeric and its health impacts on consumer safety of Lahore, Pakistan. Food Chem. Toxicol. 114116. 10.1016/j.fct.2023.114116
Santos A.R., Carreiró F., Freitas A., Barros S., Brites C., Ramos F., Sanches Silva A. 2022. Mycotoxins contamination in rice: Analytical methods, occurrence and detoxification strategies. Toxins. 14(9): 647. 10.3390/toxins14090647
Sousa T.M.A., Batista L.R., Passamani F.R.F., Lira N.A., Cardoso M.G., Santiago W.D., Chalfoun S.M. 2019. Evaluation of the effects of temperature on processed coffee beans in the presence of fungi and ochratoxin A. J. Food Saf. 39(1): e12584. 10.1111/jfs.12584
Sun G., Wang S., Hu X., Su J., Zhang Y., Xie Y., Zhang H., Tang L., Wang J.S. 2011. Co-contamination of aflatoxin B1 and fumonisin B1 in food and human dietary exposure in three areas of China. Food Addit. Contam. 28(4): 461–470. 10.1080/19440049.2010.544678
Sun J., and Wu Y. 2016. Evaluation of dietary exposure to deoxynivalenol (DON) and its derivatives from cereals in China. Food Control. 69: 90–99. 10.1016/j.foodcont.2016.04.040
Taheri N., Semnani S., Roshandel G., Namjoo M., Keshavarzian H., Chogan A.G., Kebria F.G., Joshaghani H. 2012. Aflatoxin contamination in wheat flour samples from Golestan Province, Northeast of Iran. Iran. J. Public Health. 41(9): 42–47. http://ijph.tums.ac.ir
Tittlemier S.A., Cramer B., DeRosa M.C., Dzuman Z., Kodikara C., Malone R., Maragos C., Suman M., Sumarah M.W. 2025. Developments in analytical techniques for mycotoxin determination: An update for 2023-24. World Mycotoxin J. 1(aop): 1–28. 10.1163/18750796-bja10013
Trucksess M.W. 2005. Natural toxins. In: Horwitz W., Latimer G.W. (Eds.), Official Methods of Analysis of AOAC International, AOAC International, Gaithersburg, MD, USA, pp. 1–85.
Turner N.W., Bramhmbhatt H., Szabo-Vezse M., Poma A., Coker R., Piletsky S.A. 2015. Analytical methods for determination of mycotoxins: An update (2009–2014). Analytica Chimica Acta. 901: 12–33. 10.1016/j.aca.2015.10.0130
Yi Y., Fan K., Shan Y., Fu Q., Zhou X., Zhang Y., Zhang H. 2022. Study on sampling scheme for detecting mycotoxin during wheat storage. J. Sci. Food Agric. 102(11): 4752–4758. 10.1002/jsfa.11840
Zahra N., Jamil N., Ahmad S.R., Munir S., Saeed M.K., Kalim I. 2017. Comparative analysis of brown and white rice samples for the presence of Aflatoxin B1 contamination and effect of environment temperature on Aflatoxin concentration during storage. Transylv Rev. 25: 4507–4515. http://transylvanianreviewjournal.org/