
Download
ORIGINAL ARTICLE
Influence of phenological growth stages on the bioactivity and chemical profile of Buddleja saligna (Willd.) extracts
Maboka M. Mabusela1, Babalwa Matsiliza-Mlathi1, Eugenio Aprea2, Riana Kleynhans1, Maria Concetta Tenuta3*, Abdessamie Kellil3, Pamela Gatto4, Ksenia Morozova3, Matteo M. Scampicchio3, Giovanna Ferrentino3
1Department of Horticulture, Tshwane University of Technology, Pretoria, South Africa;
2Center Agriculture Food Environment, University of Trento, Trento, Italy;
3Faculty of Agricultural, Environmental and Food Sciences, Free University of Bozen-Bolzano, Piazza Università, Bolzano, Italy;
4High Throughput Screening (HTS) and Validation Core Facility, Department CIBIO, University of Trento, Via Sommarive, Trento, Italy
Abstract
Buddleja saligna (Willd.) has been reported to have promising pharmacological activities due to its antioxidant, antimutagenic, and antibacterial properties. In this study, the plant material of B. saligna (Willd.) was harvested at the flowering, fruiting, and vegetative stages and extracted by maceration and ultrasound-assisted extraction (UAE). The extracts were then analyzed to determine the antioxidant activity, total phenolic content, antiproliferative (SK-MEL1 [melanoma cell lines] and A375M [cell line exhibiting epithelial morphology]), and genotoxic ([Chinese hamster ovary] CHO-K1) activities. Hydrogen-1 proton nuclear magnetic resonance (1H-NMR) and high performance liquid chromatography-high resolution mass spectrometry (HPLC-HRMS) analysis were performed to determine the chemical profile of the extracts. Regardless of the applied extraction method, results showed that samples collected during the flowering stage exhibited the highest antioxidant and antiproliferative activities; they also reported high cytotoxicity against melanoma cell lines but low genotoxicity against CHO-K1 cells. Moreover, samples collected during the flowering stage presented a higher concentration of bioactive compounds (verbascoside, hydroxycoumarin, isoacteroside, and luteonin derivatives) compared to those collected during the fruiting and vegetative stages. The results of this study highlight the potential benefits of B. saligna (Willd.) to produce extracts with important bioactive properties.
Key words: Buddleja saligna (Willd.), phenological growth stages, extraction methods, antioxidant activity, antiproliferative activity
*Corresponding Author: Maria Concetta Tenuta, Faculty of Agricultural, Environmental and Food Sciences, Free University of Bozen-Bolzano, Piazza Università 5, 39100 Bolzano, Italy. Email: [email protected]
Academic Editor: Prof. Bernard Fioretti, University of Perugia, Italy
Received: 28 January 2025; Accepted: 22 April 2025; Published: 1 July 2025
© 2025 Codon Publications
This is an Open Access article distributed under the terms of the Creative Commons Attribution-NonCommercial-ShareAlike 4.0 International (CC BY-NC-SA 4.0). License (http://creativecommons.org/licenses/by-nc-sa/4.0/)
Introduction
Secondary metabolites, naturally occurring chemical compounds produced by plants, possess remarkable therapeutic potential. Their biosynthesis is a dynamic process influenced by various factors related to both the plant and its environment (Ashraf et al., 2018; Feduraev et al., 2019; Tiago et al., 2017). These factors include biochemical and physiological changes that occur at different stages of the plant development, which are driven by the synthesis, transportation, and degradation of metabolites such as sugars and organic compounds (Rahali et al., 2017). The accumulation and concentration of bioactive compounds can fluctuate, depending on the season, geographical location, phenological growth stages, and environmental stress (Boussoussa et al., 2016; Mabusela et al., 2024; Ncube et al., 2011).
Buddleja saligna (Willd.), commonly known as “false olive,” is a species from the Scrophulariaceae family native to southern Africa. This species has gained significant attention due to its extensive use in traditional medicine, wide distribution, and diverse array of secondary metabolites with important bioactive properties. It is traditionally used to treat diseases such as high blood pressure, colds, coughs, urinary issues, sores, and thrush (Adedapo et al., 2009; Bamuamba et al., 2008; Chukwujekwu et al., 2016; Mabusela et al., 2024; Singh et al., 2017). This plant is particularly rich in phenolic compounds and flavonoids, contributing to its pharmacological properties, which include antioxidant, anti-inflammatory, antimicrobial, antimycobacterial, antimutagenic, and anticancer activities (Adedapo et al., 2009; Chukwujekwu et al., 2014).
Results from several studies have established that phytochemicals such as phenolic compounds and flavonoids may exhibit antioxidant and enzyme-inhibitory activities, making them effective against various diseases (Amiri et al., 2021; Bouchareb et al., 2024; Fonboh et al., 2020; Sharifi et al., 2022; Twilley et al., 2021; Venugopal and Liu, 2012). Antioxidants derived from natural plant sources are highly valued for their ability to neutralize free radicals (de Bono et al., 2020; Dizdaroglu and Jaruga, 2012; Duh et al., 2001; Gupta et al., 2020; Topal and Gulcin, 2022; Twilley et al., 2017). Based on these findings, plant-based antioxidants have gained widespread acceptance and use as safer alternatives to synthetic antioxidants (Bouras et al., 2024; Kalin et al., 2015; Topal and Gulcin, 2022).
The extraction of bioactive compounds is a critical step in harnessing their therapeutic potential (Dhanani et al., 2017; Kalin et al., 2015; Panda and Manickam, 2019). Traditional extraction methods, such as maceration and Soxhlet, are energy-intensive requiring a significant amount of solvent and processing time (Belwal et al., 2018; Dhanani et al., 2017; Rasul, 2018). Recent advances in extraction technologies have improved the efficiency and efficacy of this process. Ultrasound-assisted extraction (UAE), for instance, is recognized as an environmentally friendly method that enhances the concentration and preservation of bioactive compounds while at the same time reducing the processing times. UAE has demonstrated its ability to generate bioactive compounds with tailored functionalities (Chau Nguyen et al., 2021; Deb and Sakar, 2022; Lefebvre et al., 2021; Patel et al., 2021).
The aim of this study was to evaluate the influence of phenological growth stages on the bioactivity and chemical profile of B. saligna (Willd.) extracts obtained by maceration and UAE. Although the pharmacological properties of this plant have been well documented, many factors influencing its phytochemistry and subsequent bioactivity remain unexplored.
Material and Methods
Reagents
Gallic acid, Folin-Ciocalteu phenol reagent, sodium carbonate, 2,2-diphenyl-1-picrylhydrazyl (DPPH), deuterated methanol (CD3OD), sodium deuterium oxide (NaOD), potassium phosphate monobasic (KH2PO4), trimethylsilyl propionic acid sodium salt (TSP), deuterium oxide (D2O), and absolute ethanol and dimethyl sulfoxide (DMSO) of analytical grade were obtained from Sigma Aldrich (St. Louis, MO, USA). Dulbecco’s modified Eagle’s medium (DMEM), 0.25% trypsin-EDTA (chelating agent), phosphate buffer saline (PBS), fetal bovine serum (FBS), and glutamine were purchased from Thermo Fisher Scientific (Waltham, MA, USA). Methanol (high performance liquid chromatography [HPLC] grade) and lithium perchlorate were purchased from Honeywell (Steinheim, Germany). Cytochalasin B (sc-3519) and Mitomycin C (MMC) (sc-3514) were acquired from La Santa Cruz Biotechnology, Inc. (Heidelberg, Germany).
Plant collection
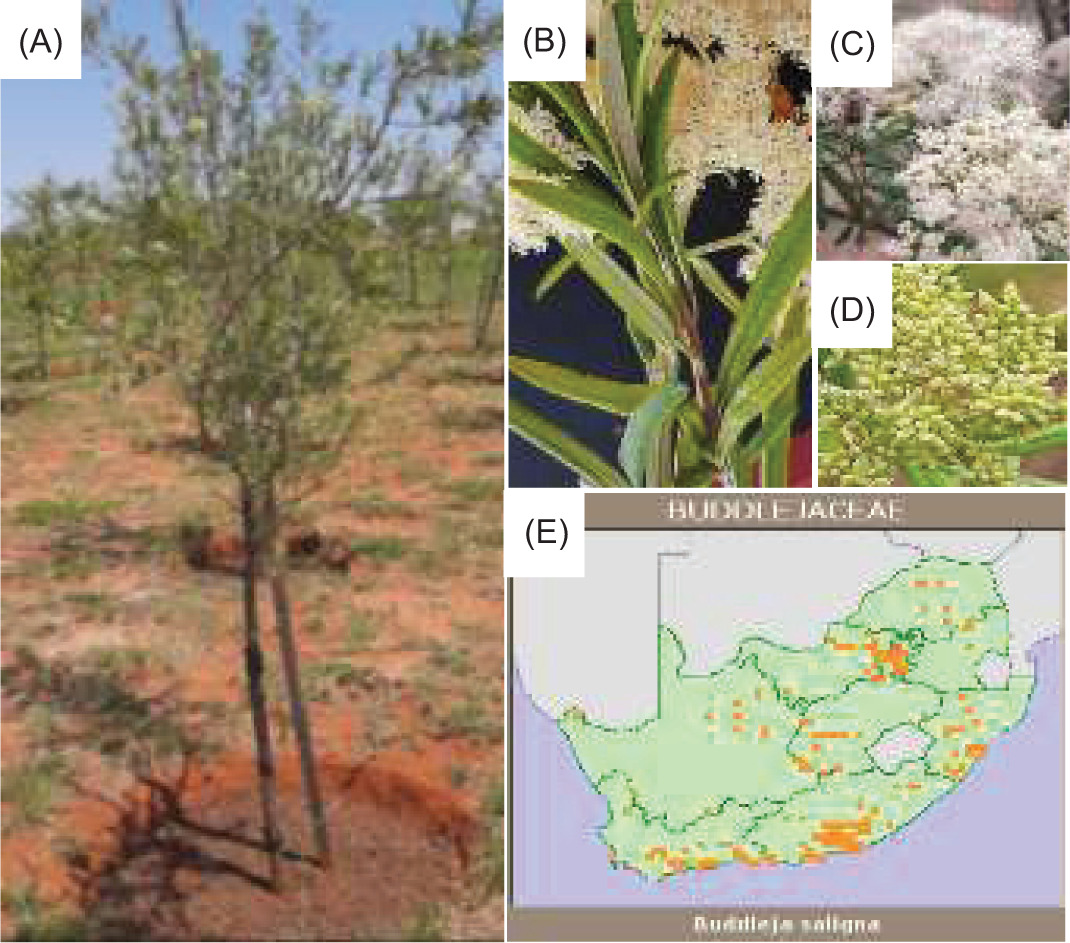
The leaves and twigs of B. saligna (Willd.) were collected at the Mothong African Heritage site (25°41’50.7”S 28°20’15.2”E) in Mamelodi, Pretoria, South Africa. The study was conducted on three phenological growth stages, namely vegetative, flowering, and fruiting stages, which were harvested sequentially in May 2023 (vegetative), October 2023 (flowering), and November 2023 (fruiting) (Figure 1). All samples were harvested in triplicate for each phenological stage.
Figure 1. The morphological characteristics of B. saligna and its distribution map: (A) whole tree, (B) leaves, (C) flowers, (D) fruits, (E) distribution map.
Extraction method
The plant material (leaves and twigs mixed in same proportions for all extractions) was oven dried at 50°C for 48 hours and ground into powder. About 15 g of the powdered B. saligna (Willd.) plant material was extracted with 150 mL of absolute ethanol using two extraction methods: UAE (Hielscher, digital ultrasonic generator, Italy) at 60% amplitude (345 W, 37 kHz) for 1 hour at 25°C and maceration at the same temperature using an orbital shaker for 1 hour. Extractive solutions, after being filtered with a Buchner funnel (using Whatman N. 1 filter paper), were evaporated under reduced pressure at 45°C to obtain dry crude extracts. The extract yield was calculated as the ratio between the weight of the dried extracts divided by the weight of the ground plant material multiplied by 100%. The dried extracts were then stored at 4°C until further analysis.
Classical DPPH assay
According to the methods previously described by Mosibo et al. (2022), with minor modifications, the antioxidant capacity of the extracts was determined by a 2,2-diphenyl-2-picrylhydrazyl (DPPH) radical scavenger. The extract (10 mg) was dissolved into 1 mL of ethanol and diluted 100 times and 500 µL of the DPPH working solution (200 µM) was mixed with 500 µL of the extracts (1:1). The samples were incubated for 1 hour at ambient temperature in the dark and the absorbance was measured at 515 nm using a spectrophotometer (Cary 100 Series UV-Vis Spectrophotometer, Agilent Technologies, Italy). Trolox was used as positive control. The analysis was performed in triplicate and the results were expressed as Trolox equivalent (TE) per gram of dry extract.
Total phenolic content
As described by Margraf et al. (2015), with minor modifications, the total phenolic content (TPC) of B. saligna (Willd.) extracts were analyzed using the Folin-Ciocalteu method. Briefly, the dry extract was reconstituted in a known volume of ethanol to prepare a stock solution. For the assay, 40 µL of extract was mixed with 1200 µL distilled water, 300 µL 20% sodium carbonate solution, and 100 μL Folin-Ciocalteu and mixed for 30 seconds. The samples were then incubated in the dark for 2 hours and the absorbance was measured at 765 nm using a spectrophotometer (Cary 100 Series UV-Vis Spectrophotometer, Agilent Technologies, Italy). Gallic acid was used as a standard. The results were expressed as milligrams of gallic acid equivalent (GAE) per gram of dry extract.
Stopped-flowed kinetic-based DPPH assay
According to the method developed by Angeli et al. (2023), with minor modifications, the kinetic-based DPPH method was performed and measured using a stopped-flow system (RX2000, Applied Photophysics, Leatherhead, UK) equipped with a pneumatic pump, a quartz flow cell, and a Cary 60 UV-VIS spectrophotometer (Agilent Technology, Santa Clara, CA, USA). Equal volumes (1:1) of DPPH working solution (200 µM) and extracts (standardized at 60 µM of GAE) were mixed and transferred to the quartz flow cell with a maximum delay of 6 milliseconds. The absorbance values were measured at a wavelength of 515 nm (nanometer). The DPPH concentration was calculated from the recorded absorbance signal using the Beer-Lambert law. The results of the kinetic DPPH method were expressed with two reaction rates, namely k1 for the main reaction (AH + n•DPPH →k1 A + DPPH−H) and k2 for the side reactions that take place between the oxidized antioxidants and the DPPH free radical (A + DPPH →k2 A Products). The simulation and fitting of the reaction kinetic data was performed using the Copasi software (version 4.29). The analysis was carried out in triplicate.
Antiproliferative activity
Cell lines culture and maintenance
The cell lines human malignant melanoma (SK-MEL-28 [one of a series of melanoma cell lines] and A375M) were kindly provided by Prof. Alessandra Bisio, Department CIBIO, University of Trento, while the Chinese hamster ovary K1 (CHO-K1) rodent mammalian cell line was kindly provided by Prof. Fulvio Chiacchera, Department CIBIO, University of Trento. The cell lines were grown and maintained in tissue culture flasks containing DMEM (SK-MEL-28), RPMI (A375M), and HAM’s F-12 nutrient mixture (Euroclone SpA, Pero, Milan, Italy) for CHO-K1 cells in an incubator with 5% carbon dioxide (CO2) at 37°C. DMEM, RPMI, and HAM’s F-12 media were supplemented with 10% heat-inactivated FBS and 1% antibiotics (100 U/mL penicillin and 100 µg/mL streptomycin) and 2 mM L-glutamine; 1% nonessential amino acid (NEA) was added only to DMEM. The cells were detached with Trypsin EDTA (0.1%), followed by the addition of medium to inhibit the reaction.
In vitro antiproliferative activity
The antiproliferative study of B. saligna (Willd.) extracts was performed for the three main phenological growth stages (vegetative, flowering, and fruiting) and tested on two melanoma cell lines (SK-MEL-28 and A375M). A total of 100 µL cells were seeded in 96-well plates (Costar) at a concentration of 3 × 10⁴ and 7 × 10⁴ cells/mL for A375M and SK-MEL-28, respectively, and allowed to adhere for 24 hours at 5% CO2 and 37°C. The day after cell seeding, B. saligna (Willd.) extract was prepared by creating a stock concentration of 40 mg/mL in DMSO, serially diluted, and then added in 100 µL to the cells for a final concentration of 400 µg/mL to 3.125 µg/mL. A positive control, 5-Fluorouracil (5-FU), was added in 100 µL to the cells for the final concentrations ranging from 10 µM to 0.31 µM. A volume of 100 µL of the negative controls, DMSO (vehicle control) at a final concentration of 1%, and medium were added to the cells. The cells were then incubated with the respective samples and controls at 5% CO2 and 37°C for 72 hours. Cell analysis was performed using a propidium iodide (PI) solution, a red fluorescent dye that binds deoxyribonucleic acid (DNA) cell nulcei, allowing the quantification of the cellular DNA content during cell cycle progression.
Cells were imaged on the High Content Screening System Operetta™ (PerkinElmer, Waltham, MA, USA). In each well, images were acquired in preselected fields (5) with LWD 10× objective over two channels with λ = 380 nm main excitation/λ = 445 nm main emission for Hoechst, with λ = 535 nm main excitation/λ = 615 nm main emission for PI. For the feature extraction, the images were analyzed by Harmony software version 4.1 (PerkinElmer). Based on the Hoechst dye, cell nuclei were identified and the mean PI fluorescence intensity was quantified in the nucleus. A subpopulation of cells having PI fluorescence intensity above a defined threshold (250 r.u.) was selected and defined as PI positive cells.
The result of the analysis comprises the quantification of viable cells by subtracting the PI-positive cell nuclei from its total number. The percentage of growth was calculated by normalizing the number of viable cells of the treated samples after 72 hours (Ti) over the number of viable cells in the negative control DMSO (C), in view of the initial number of viable cells before treatment as time zero (Tz). Percentage growth was calculated as ([Ti-Tz]/[C-Tz]) × 100 for concentrations where Ti >/ =Tz or ([Ti-Tz]/Tz) × 100 for concentrations where Ti < Tz. Normalized data were plotted against the extract’s concentration and the half maximal effective concentration (EC50) was calculated from the percentage cell viability using nonlinear regression with GraphPad Prism 4 software. Three independent experiments with three internal replicates were performed for all treatments.
Genotoxicity study using cytokinesis-block micronucleus assay
Genotoxic side effects of test substances induce the formation of micronuclei (MN) in cells. MN in interphase cells are relatively easy to determine, making the in vitro MN assay a favored tool for assessing the genotoxic potential of test compounds. The cytokinesis block micronucleus (CBMN) assay was performed according to the methods described by Bernardi et al. (2014) and in accordance with the Organization for Economic Co-operation and Development (OECD) guidelines for the testing of chemicals (In vitro Mammalian Cell Micronucleus Test No. 487). The cells (CHO-K1) were seeded at a concentration of 2 × 10³ per well in the 96-well flat bottom plates (Costar) in a volume of 100 μL and incubated in a humidified atmosphere at 37°C and 5% CO2 for 24 hours prior to the addition of the tested samples. After 24 hours, the cells were treated with DMSO (at 1% final concentration) or medium only as negative controls, with MMC (micronucleus formation inducer) as a positive control (0.02 µg/mL, 0.06 µg/mL, and 0.2 µg/mL as final concentrations) and with B. saligna (Willd.) extracts serially diluted to a final concentration of 400 µg/mL to 3.125 µg/mL after adding 100 µL to the cells. Following 24 hours of incubation, the medium was changed (150 µL removed and 150 µL of complete medium added) and the cells were incubated with 3 µg/mL of the cytokinesis blocking agent cytochalasin B (prevents the separation of daughter cells after mitosis, which leads to the formation of binucleated cells) for a further 24 hours. Finally, the cells were fixed with 4% formaldehyde for 15 minutes, washed twice with PBS, and stained with Hoechst 33342 (2 µg/mL in PBS) for 30 minutes in the dark at room temperature. Images were acquired with the Operetta High-Content Imaging System (PerkinElmer) with a 20X wide field objective and analyzed with the micronucleus analysis module from the Harmony software database (PerkinElmer). The MN analysis of CHO-K1 cells included the detection of the nuclei, cytoplasm, and MN. The analysis consisted of two key steps: the morphological identification of regularly shaped binuclear cells and the segmentation of MN as located in the cytoplasm of those cells without any connection to the main nuclei, with the intensity similar to the respective nuclei and dimensions less than 33% of the main nuclei. MN are scored only in the cells that have undergone mitosis during and after treatment. The percentage of binucleated cells with MN is a genotoxicity index. Using two different methods, cytotoxicity was assessed as a part of the MN experiment in the same cells used to score MN. As previously published by Al-Naqeb et al. (2022), the percentage of cytotoxicity based on estimation of the reduction of cell number upon treatment and percentage of cytotoxicity Cytokinesis Block Proliferation Index (CBPI) were calculated.
Metabolomic analysis
1H-NMR metabolomics analysis
According to the method described by Maree and Viljoen (2012), with minor modifications, an untargeted metabolomics analysis was performed using 1H-NMR. The buffer was prepared by adding 1.232 g KH2PO4 to 100 mL D2O, with 10 mg TSP (0.1%) added as a reference standard. The pH of the solution was adjusted to pH = 6. About 12–15 mg of the plant extract was weighed into 2 mL centrifuge tubes and extracted with 750 µL deuterated methanol and 750 µL KH2PO4 buffer in D2O containing 0.1% TSP. Samples were then vortexed for 1 minute at room temperature and sonicated for 20 minutes without heating. They were then centrifuged at 13,000 rpm for 12 minutes to separate the supernatant from the precipitate. From each sample, 750 µL of the supernatant from the centrifuge was then transferred to 5 mm NMR tubes and subjected to 1H-NMR analysis. The spectra of 1H-NMR analysis were performed using a Varian 600 MHz NMR spectrometer with 32 scans. Spectral data were processed using MestReNova software (9.0.1, Mestrelab Research, A Coruña, Spain), whereby the spectral data were subjected to phase and base correction, a referencing of the TSP peak (standard) to 0.000 ppm and normalizing to 100%. The spectral intensities were then reduced to integrated regions of equal width (0.04 ppm each) corresponding to the range from 0.04 ppm to 10 ppm. Simulated spectra of the main compounds detected in the extracts were obtained using MestReNova software (9.0.1, Mestrelab Research). Data were analyzed using Simca 14 (Umetrics, Umea, Sweden) and subjected first to an unsupervised method—principal component analysis (PCA)—using Pareto scaling.
HPLC-HRMS
The analysis was performed using an Ultimate 3000 UHPLC instrument (Thermo Fisher Scientific) with UV-Vis detector and Q-Exactive Orbitrap high resolution mass spectrometry (HRMS) instrument (Thermo Fisher Scientific). A Kinetex Biphenyl column (100 × 2.1 mm, 2.6 µM particle size, Phenomenex, CA, USA) was utilized for the analysis. The column temperature was kept constant at 30°C. The mobile phases were Milli-Q water with 0.5% acetic acid (v/v) (A) and methanol with 0.5% acetic acid (v/v) (B). Before injection, the samples (vegetative, flowering, and fruiting) were dissolved in 2 mL of methanol and filtered using 0.22 µm pore size filters with the injection volume set at 20 µL. A constant flow rate of 0.3 mL/minute was maintained using the following gradient for optimal chromatographic separation: from 0 to 2 minutes with 5% of eluent B; from 8 to 11 minutes with 30% of eluent B; from 11 to 26 min with an increased percentage of eluent B from 30% to 60%; from 36 to 39 minutes with 90% of eluent B; from 39 to 42 minutes with a decreasing percentage of eluent B from 90% to 5%; followed by 5 minutes of column equilibration. Identification of the compounds was obtained by comparing the tandem mass spectrometry (MS-MS) with online databases. MS analysis can be operated in both positive and negative ion mode with ultrapure nitrogen as sheath (20 arb) and auxiliary (5 arb) gas (250°C). The capillary voltage was maintained at 4.5 kV, while the capillary temperature was set at 320°C. The full MS scan was acquired from 50 m/z (mass-to-charge ratio of an ion) to 750 m/z with a resolution at 70,000, automatic gain control (AGC) target at 3⋅106, and maximum injection time of 100 millisecond. The dd(data-dependent)-MS/MS settings were as follows: AGC target at 5⋅105, maximum injection time 50 millisecond, resolution at 17,500, and isolation window at 4.0 m/z. The MS data and results were collected and analyzed by Xcalibur 3.1 and Compound Discoverer 3.3 software (Thermo Scientific). The results were expressed in area percentage of each compound compared to the total area compounds present in the extract.
Data analysis
The experimental results were expressed as the mean of three replicates. Analysis of variance was carried out using GenStat release 18.1 to determine the effect of phenological growth stages and extraction methods on bioactivity. Duncan’s test was applied at a 5% significance level to compare means of significant effects.
Results and Discussion
Effect of phenological growth stages and extraction methods on yield, total phenolic content, and antioxidant activity
B. saligna (Willd.) specimens were harvested at various phenological growth stages (vegetative, fruiting, and flowering), and then oven-dried and extracted using one of two extraction methods (UAE or maceration) to provide a comparative analysis on how the growth stage of the plant and the extraction technique influenced the recovery of bioactive compounds and their antioxidant potential (Table 1). The highest extraction yields were obtained from plant material collected during the vegetative (17.2% ± 0.5%) and flowering (17.2% ± 1.1%) stages and extracted using UAE; however, the fruiting stage resulted in significantly lower yield across the two extraction methods (ranging from 11.3% ± 0.8% to 16.1% ± 1.1%).
Table 1. Influence of phenological growth stages and extraction methods on the yield, total phenolic content, and antioxidant activity of B. saligna (Willd.) extracts.
| Extraction methods | PS | Yield (%) | TPC (mg GAE/g) | DPPH kinetic k (M-1 s-1) | DPPH classical (mg TE/g) |
|---|---|---|---|---|---|
| Maceration | Vegetative | 14.2 ± 0.7d | 225.0 ± 9.26bc | 983.4 ± 27.3b | 81.1 ± 0.5ab |
| Flowering | 14.2 ± 1.1d | 203.0 ± 43.8cd | 899.0 ± 12.3d | 89.2 ± 6.1ab | |
| Fruiting | 11.3 ± 0.8e | 162.0 ± 22.9e | 633.3 ± 13.8ef | 92.5 ± 3.1a | |
| UAE | Vegetative | 17.2 ± 0.5c | 271.0 ± 4.97a | 1146.4 ± 40.3a | 86.3 ± 1.1ab |
| Flowering | 17.2 ± 1.1c | 224.0 ± 8.05bc | 1012.6 ± 25.3b | 94.3 ± 0.7b | |
| Fruiting | 16.1 ± 1.1bc | 177.0 ± 37.3de | 681.5 ± 21.9f | 96.2 ± 3.9ab |
PS: phenological stage; TE: trolox equivalent; k: kinetic constant obtained from the fitting of the DPPH curves. Values are presented as mean values ± standard deviation (n = 3). Values with the same letter in the same column do not differ significantly from each other at 5% level of significance.
Following a similar pattern, the highest TPC was recorded in samples harvested during the vegetative stage and extracted using UAE (271 mg ± 4.97 mg GAE/g), while the lowest TPC was found in samples macerated and collected during the fruiting stage (162 mg ± 22.9 mg GAE/g).
Regarding the antioxidant activity, the classical DPPH assay did not reveal any significant differences between the extraction methods or the phenological stages of the plant (Table 1). This assay provides a single time point measurement, which may not reflect the rate at which antioxidants neutralize radicals. To address this limitation, the DPPH stopped-flow kinetic assay was applied, which allows for a more dynamic evaluation of antioxidant activity, including the rate of radical scavenging.
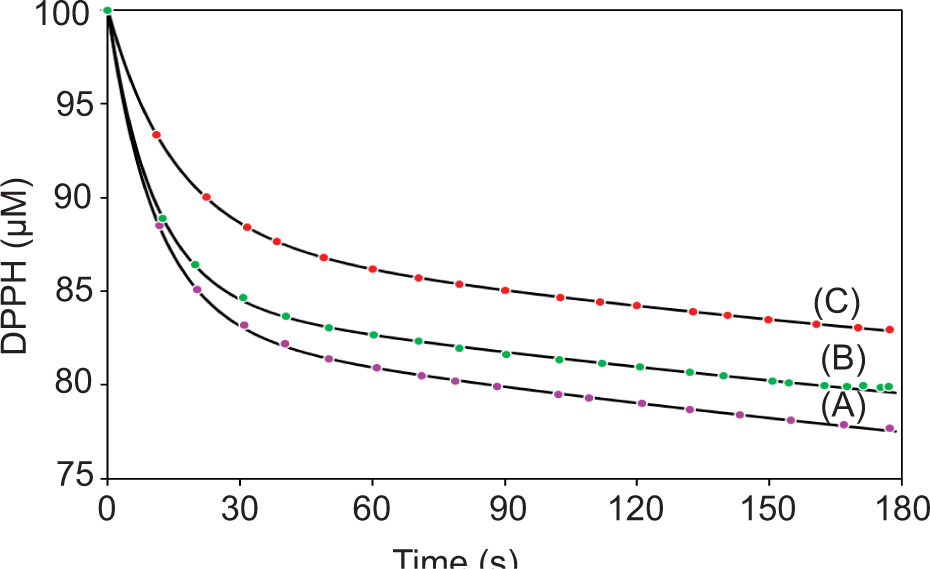
As indicated by the DPPH kinetic constant (k), the fastest antioxidant reaction rates were observed in samples collected during the vegetative stage and extracted with UAE (1146.4 ± 40.3 M-1 s-1) (Figure 2), while samples collected during the fruiting stage exhibited the lowest antioxidant activity for both extraction methods.
Figure 2. Kinetic curves with fittings of the reaction between 100 μM of DPPH and B. saligna samples (standardized to 30 μM GAE) extracted using UAE during: vegetative (A); flowering (B); and fruiting stage (C).
The highest extraction yields during the vegetative and flowering stages can be attributed to the active metabolic processes during these growth phases, where secondary metabolites such as phenolics are abundant (Adegbaju et al., 2020). This is particularly true for flavonoids like quercetin, which accumulate during the active growth and decrease post-flowering, as the plant shifts its energy toward differentiation rather than metabolite synthesis (Biswas et al., 2023; Kocabey et al., 2016; Xue and Li, 2023). Additionally, the faster antioxidant reaction rate observed in the samples collected during the vegetative stage and extracted with UAE suggested a higher presence of reactive compounds, likely flavonoids and other phenolics, which are abundant during this stage.
These results are consistent with previous studies. Khodabande et al. (2017) and Farhadi et al. (2020) similarly reported higher antioxidant activity and phenolic content in Chelidonium majus and Achillea millefolium L., respectively, when harvested during the vegetative and flowering stages compared to the fruiting stage. The authors attributed the increased antioxidant activity during the vegetative stage to the accumulation of flavonoids during early growth, which declined as the plant progressed to the fruiting stage (Farhadi et al., 2020; Khodabande et al., 2017).
Antiproliferative assay against skin melanoma cell lines
The phenological growth stages significantly affected the antiproliferative activity of B. saligna (Willd.) as expressed by EC50 (µg/mL) value, calculated on the number of viable cells after treatment normalized by the untreated ones (Table 2). The A375M cell line was the most vulnerable to the treatments (EC50 ranging from 50.4 µg/mL ± 5.3 µg/mL to 88.1 µg/mL ± 0.3 µg/mL), while the SK-MEL-28 cell line was the most resistant (EC50 ranging from 58 µg/mL ± 9.5 µg/mL to 112 µg/mL ± 17.9 µg/mL). Plant material collected during the flowering stage had significantly higher antiproliferative activity for A375M and SK-MEL-28 for both extraction methods; however, the samples collected during the vegetative stage had significantly lower antiproliferative activity, except for the plant material extracted with UAE against A375M cells.
Table 2. Effect of phenological stages and extraction methods on the antiproliferative activity of B. saligna (Willd.) extracts.
| Extraction methods | Phenological stages | SK-MEL-28 EC50(µg/mL) | A375M EC50(µg/mL) |
|---|---|---|---|
| Maceration | Vegetative | 112 ± 17.9a | 88.1 ± 0.3a |
| Flowering | 75.8 ± 7.9cd | 58.2 ± 7.9b | |
| Fruiting | 81.3 ± 8.2bcd | 69.9 ± 9.2ab | |
| UAE | Vegetative | 88 ± 5.1abc | 63.6 ± 7.6b |
| Flowering | 58 ± 9.5d | 50.4 ± 5.3b | |
| Fruiting | 78.7 ± 5.3bcd | 63.6 ± 9.4b | |
| 5-Fluorouracil (5-FU) | Positive control | 0.52 µM | 0.39 µM |
Mean values labeled with the different letters in a column differ significantly from each other at 5% level of significance. EC50 (µg/mL) indicates half the maximum effective concentration.
Cytotoxicity and genotoxicity using MN assay on Chinese hamster ovary K1 cell line
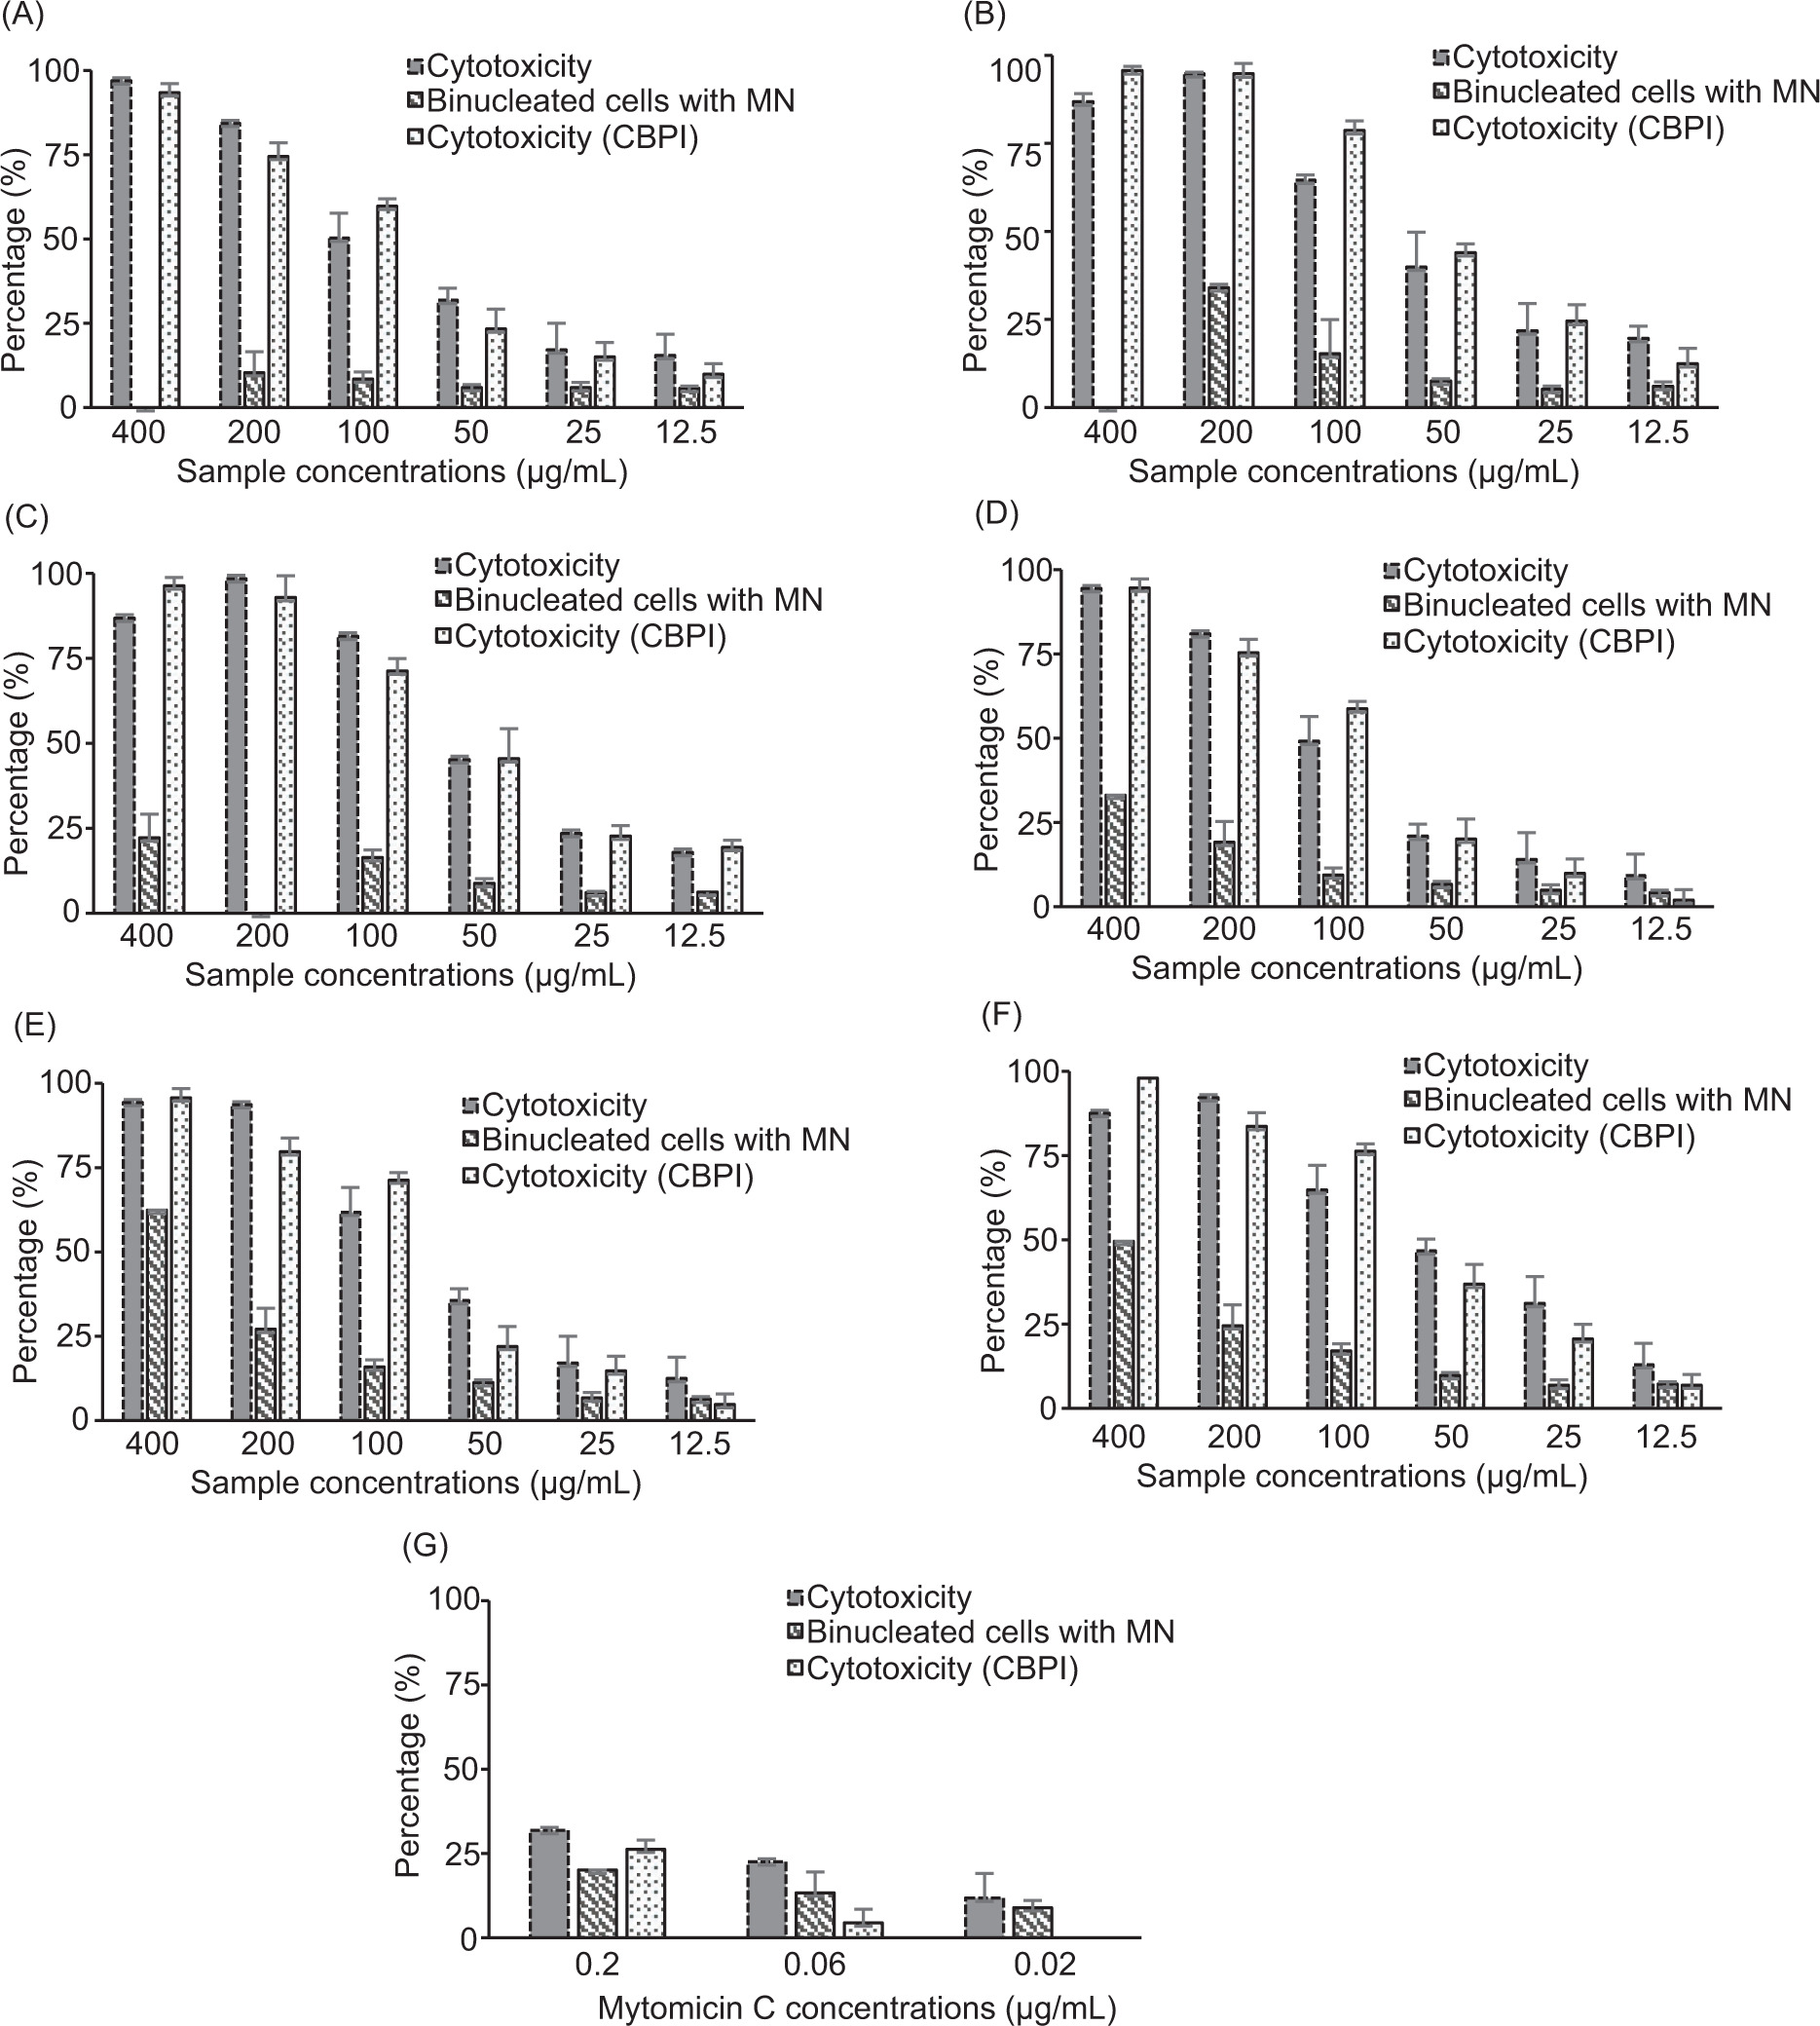
The cytotoxicity and genotoxicity in CHO-K1 cells after incubation with different concentrations of the various extracts is shown in Figure 3. MMC was used as a positive control for both assays. Two different methods were used to assess cytotoxicity: one based on the estimation of the reduction of cell number upon treatment (percentage of cytotoxicity) while the other one was based on the Cytokinesis Block Proliferation Index (percentage of CBPI) as recommended in the OECD guidelines (2023).
Figure 3. Percentage of cytotoxicity and cytotoxicity CBPI and of binucleated cells with MN in CHO-K1 cells after a 24-hour incubation with different concentrations of the tested samples (µg/mL) and subsequent 24-hour incubation with 3 μg/mL cytochalasin B. (A) B. saligna (BS) material harvested at the vegetative stage and extracted by maceration; (B) BS material harvested at the fruiting stage and extracted by maceration; (C) BS material harvested at the flowering stage and extracted by maceration; (D) BS material harvested at the vegetative stage and extracted by UAE; (E) BS material harvested at the fruiting stage and extracted by UAE; (F) BS material harvested at the flowering stage and extracted by UAE; (G) MMC (positive control).
A dose-dependent cytotoxic effect was observed for each treatment. The two methods produced consistent results except for samples collected during the fruiting stage and processed by UAE (Figure 3E), for which the CBPI score appeared to be more sensitive.
Treating CHO-K1 cells with the positive control MMC resulted in significant concentration-dependent increase of binucleated cells containing MN (genotoxic effect): 9.3% ± 2.2%, 14.1% ± 2.5%, and 22.4% ± 4.9% upon 0.02 µg/mL, 0.06 µg/mL, and 0.2 µg/mL MMC treatment, respectively, versus 5.8% ± 2.1% in DMSO-treated control. In general, the extracts exhibited low genotoxicity as the highest concentration tested (400 µg/mL) retained less than 50% of the binucleated cells with MN, except for the samples collected during the flowering stage (60%) and the fruiting stage (53%) and extracted with UAE (Figure 3E and 3F), which had over 50% of the binucleated cells with MN at the highest concentration tested.
Characterization of B. saligna (Willd.) extracts through HPLC-HRMS
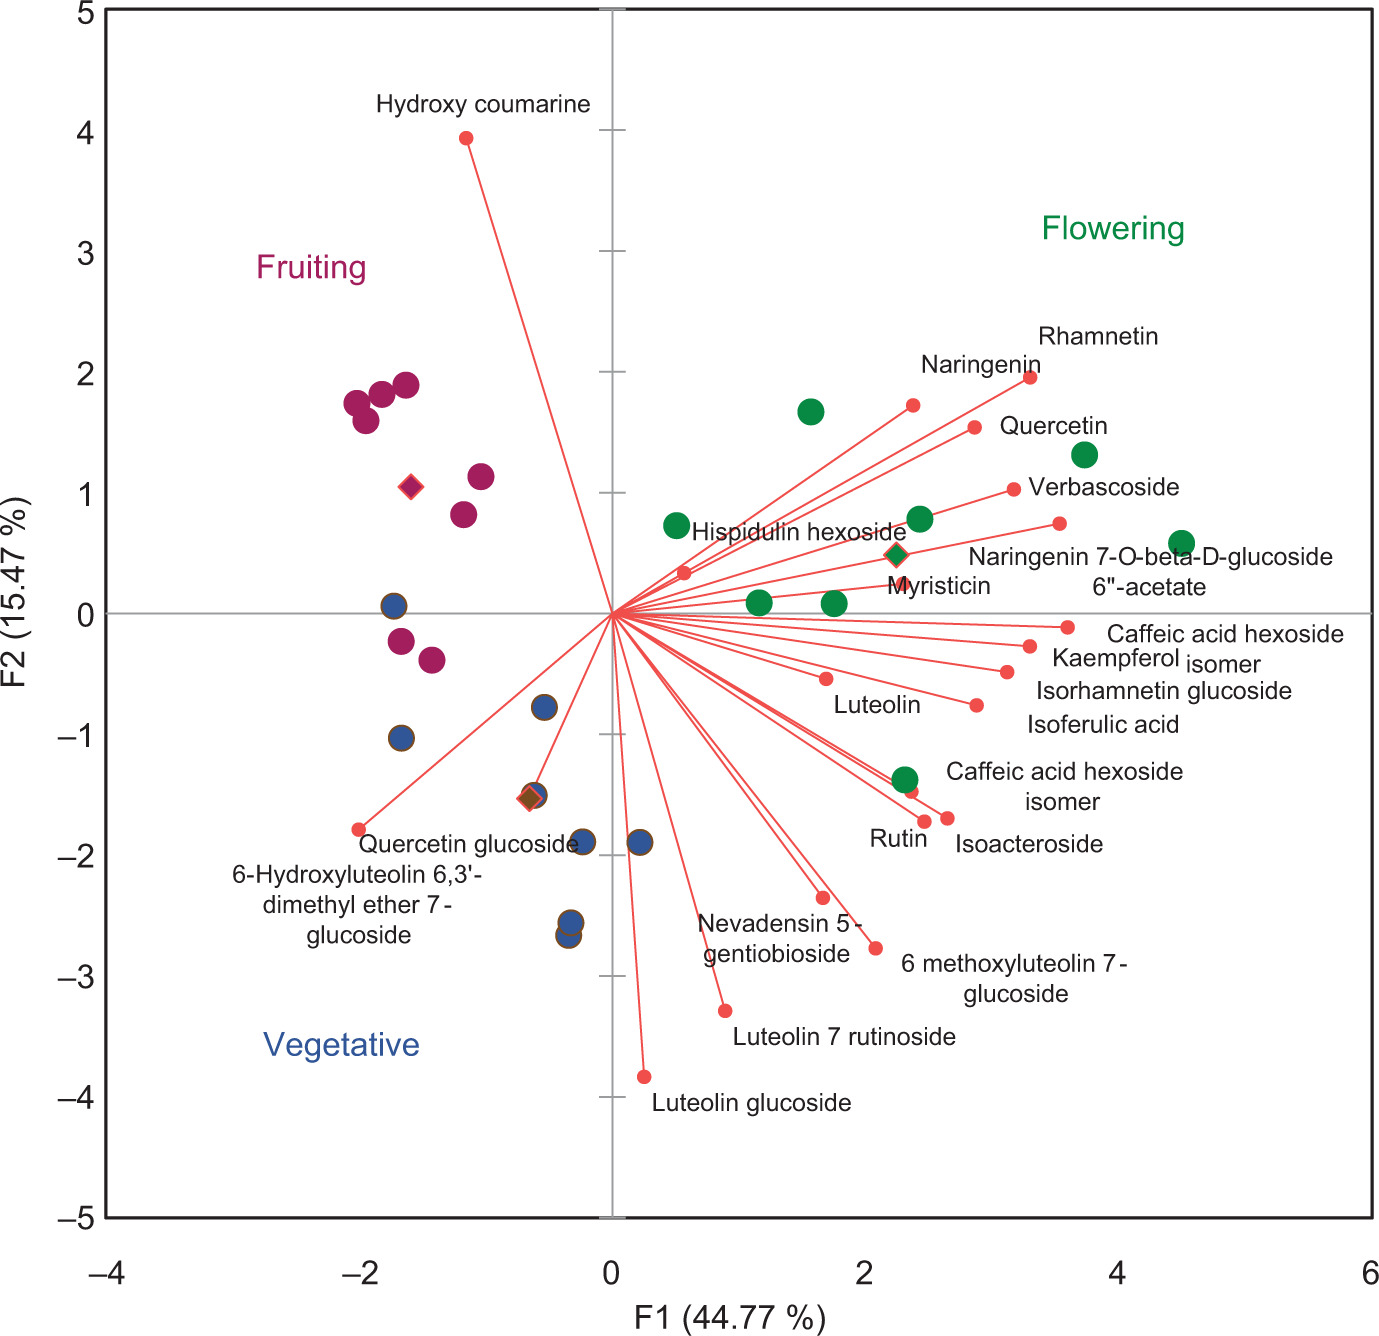
To better understand the effects of the phenological growth stages and extraction methods on the antioxidant activity of B. saligna (Willd.) extracts, a characterization of the potential compounds was carried out using HPLC-HRMS. A total of 22 compounds were detected and presumably identified in the B. saligna extracts (Table 3). The most abundant compounds detected in all extracts were verbascoside, 6-Hydroxyluteolin 6,3’-dimethyl ether 7-glucoside, and nevadensin 5-gentiobioside. The extraction method had an effect on the concentration of bioactive compounds regardless of the phenological growth stages. Caffeic acid hexoside and 6-methoxyluteolin-7-glucoside were not detected in the samples collected during the fruiting stage and extracted with maceration, while isorhamnetin hexoside was not detected in the sample collected in the fruiting stage but extracted with UAE (Table 3). A PCA was performed to determine the differences in chemical composition of the samples from different phenological growth stages. The resulting biplot of the PCA is shown in Figure 4. The samples appear to be separated and clustered by phenological growth stages as the first two principal components modeled a total variation of 60.25 %, of which the first principal component accounted for the largest proportion (44.77 %). The samples collected at the flowering stage were separated from the vegetative and fruiting stages by principal component 1, as the samples at this phenological stage had a higher concentration of bioactive compounds such as verbascoside, luteolin, isoferulic acid, kaempferol, and other compounds.
Table 3. Retention time (RT) and concentrations (%) of the compounds detected in the samples of B. saligna (Willd.) from different phenological stages.
| Peak | Compound | Formula | Adduct | m/z theoretical | m/z measured | Fragmentation | RT (min) | Vegetative | Fruiting | Flowering | |||
|---|---|---|---|---|---|---|---|---|---|---|---|---|---|
| UAE | Maceration | UAE | Maceration | UAE | Maceration | ||||||||
| % | |||||||||||||
| 1 | Caffeic acid hexoside | C15H18O9 | [M + H]+ | 343.1024 | 343.1026 | 163.0392/145.0286 | 7.10 | 0.399 | 0.612 | 0.522 | - | 0.549 | 0.585 |
| 2 | Caffeic acid hexoside | C15H18O9 | [M + H]+ | 343.1024 | 343.1026 | 163.0392/145.0286 | 7.80 | 0.204 | 0.440 | 0.479 | - | 0.660 | 0.412 |
| 3 | Isoferulic acid | C10H10O4 | [M + H]+ | 195.0652 | 195.0655 | 163.0393/116.9861 | 10.16 | 0.662 | 0.702 | 0.611 | 0.610 | 0.663 | 0.740 |
| 4 | Myristicin | C11H12O3 | [M + H]+ | 193.0859 | 193.0862 | 133.0650/105.0700 | 10.46 | 0.816 | 0.788 | 0.623 | 0.601 | 0.837 | 0.817 |
| 5 | Nevadensin 5-gentiobioside | C30H36O17 | [M – H]– | 667.1879 | 667.1881 | 343.0838/328.0599 | 15.00 | 7.699 | 6.830 | 6.068 | 5.512 | 4.931 | 3.638 |
| 6 | Rutin | C27H30O16 | [M + H]+ | 611.1606 | 611.1618 | 303.0501/304.0535 | 16.06 | 1.467 | 1.279 | 0.983 | 1.042 | 0.910 | 0.979 |
| 7 | Quercetin-3β-D-glucoside | C21H20O12 | [M + H]+ | 465.1027 | 465.1034 | 303.0500/304.0535 | 16.50 | 2.138 | 1.730 | 1.027 | 1.470 | 0.803 | 0.747 |
| 8 | Verbascoside | C29 H36 O15 | [M – H]– | 623.1981 | 623.1981 | 461.1657/161.0244 | 16.95 | 48.927 | 50.725 | 49.098 | 55.132 | 59.279 | 61.588 |
| 9 | Hydroxycoumarine | C9H6O3 | [M + H]+ | 163.0389 | 163.0391 | 163.0391/164.0427 | 18.38 | 2.873 | 3.261 | 6.421 | 7.652 | 2.578 | 2.764 |
| 10 | Isorhamnetin hexoside | C22H22O12 | [M + H]+ | 479.1184 | 479.1191 | 317.0657/302.0422 | 19.00 | 0.996 | 2.599 | - | 1.297 | 4.389 | 2.449 |
| 11 | Luteolin 7 rutinoside | C27H30O15 | [M – H]– | 593.1512 | 593.1512 | 447.0934/285.0407 | 18.20 | 1.002 | 0.953 | 0.497 | 0.585 | 0.352 | 0.349 |
| 12 | Isoacteoside | C29H36O15 | [M – H]– | 623.1981 | 623.1982 | 461.1657/161.0244 | 19.60 | 4.188 | 4.372 | 0.897 | 0.948 | 2.340 | 1.998 |
| 13 | Luteolin 7 glucoside | C21H20O11 | [M – H]– | 447.0933 | 447.0935 | 327.0505/357.0616 | 20.30 | 3.407 | 3.205 | 1.910 | 1.891 | 1.914 | 2.510 |
| 14 | 6-Methoxyluteolin 7-glucoside | C22 H22 O12 | [M – H]– | 477.1038 | 477.1038 | 447.0933/327.0503 | 20.60 | 5.283 | 5.059 | 5.591 | - | 2.332 | 2.295 |
| 15 | Quercetin | C15 H10O7 | [M + H]+ | 303.0499 | 303.05 | 303.0500/257.0446 | 21.90 | 2.041 | 2.050 | 2.085 | 2.448 | 4.618 | 3.983 |
| 16 | Hispidulin hexoside | C22H22O11 | [M + H]+ | 463.1235 | 463.1241 | 301.0709/286.0473 | 22.20 | 0.760 | 0.762 | 0.997 | 1.035 | 0.371 | 0.475 |
| 17 | Luteolin | C15H10O6 | [M + H]+ | 287.0550 | 287.0551 | 287.0552/153.0183 | 22.70 | 1.547 | 1.425 | 2.120 | 1.737 | 1.503 | 1.594 |
| 18 | Naringenin | C15H12O5 | [M + H]+ | 273.0757 | 273.0760 | 153.0185/147.0444 | 23.00 | 1.6743 | 1.219 | 2.034 | 1.921 | 1.503 | 2.002 |
| 19 | Kaempferol | C15H10O6 | [M + H]+ | 287.0550 | 287.0551 | 287.0550/289.0609 | 24.50 | 1.533 | 1.741 | 0.915 | 0.903 | 2.105 | 2.204 |
| 20 | 6-Hydroxyluteolin 6,3’-dimethyl ether 7-glucoside | C23H24O12 | [M + H]+ | 493.1340 | 493.1345 | 331.0811/332.0844 | 25.60 | 9.347 | 7.092 | 13.289 | 10.674 | 2.648 | 3.055 |
| 21 | Naringenin 7-O-beta-D-glucoside 6-acetate | C23 H24O11 | [M + H]+ | 477.1391 | 477.1398 | 273.0759/153.0303 | 25.90 | 2.705 | 2.417 | 2.766 | 3.304 | 2.769 | 2.898 |
| 22 | Rhamnetin | C16H12O7 | [M + H]+ | 317.0655 | 317.0658 | 317.0658/318.0692 | 30 | 0.331 | 0.741 | 1.066 | 1.240 | 1.947 | 1.917 |
Figure 4. Score plot of bioactive compounds detected in the three phenological stages (vegetative, flowering, and fruiting) of B. saligna (Willd.) extracts.
Hydroxycoumarin was prevalent in samples collected at the fruiting stage, whereas quercetin glucoside and 6-hydroxyluteolin 6,3’-dimethyl ether 7-glucoside were present in samples collected at the vegetative stage (Table 3; Figure 4). No significant differences were detected between the bioactive compounds obtained from the macerated samples and the samples obtained by the UAE method; however, the UAE was performed in a significantly shorter time. This short extraction time was due to the increased mass transfer rate, enhanced solvent permeability in the cells, and improved diffusion due to the cavitation phenomenon (Gasparini et al., 2023).
Metabolomic fingerprint of B. saligna (Willd.) extracts
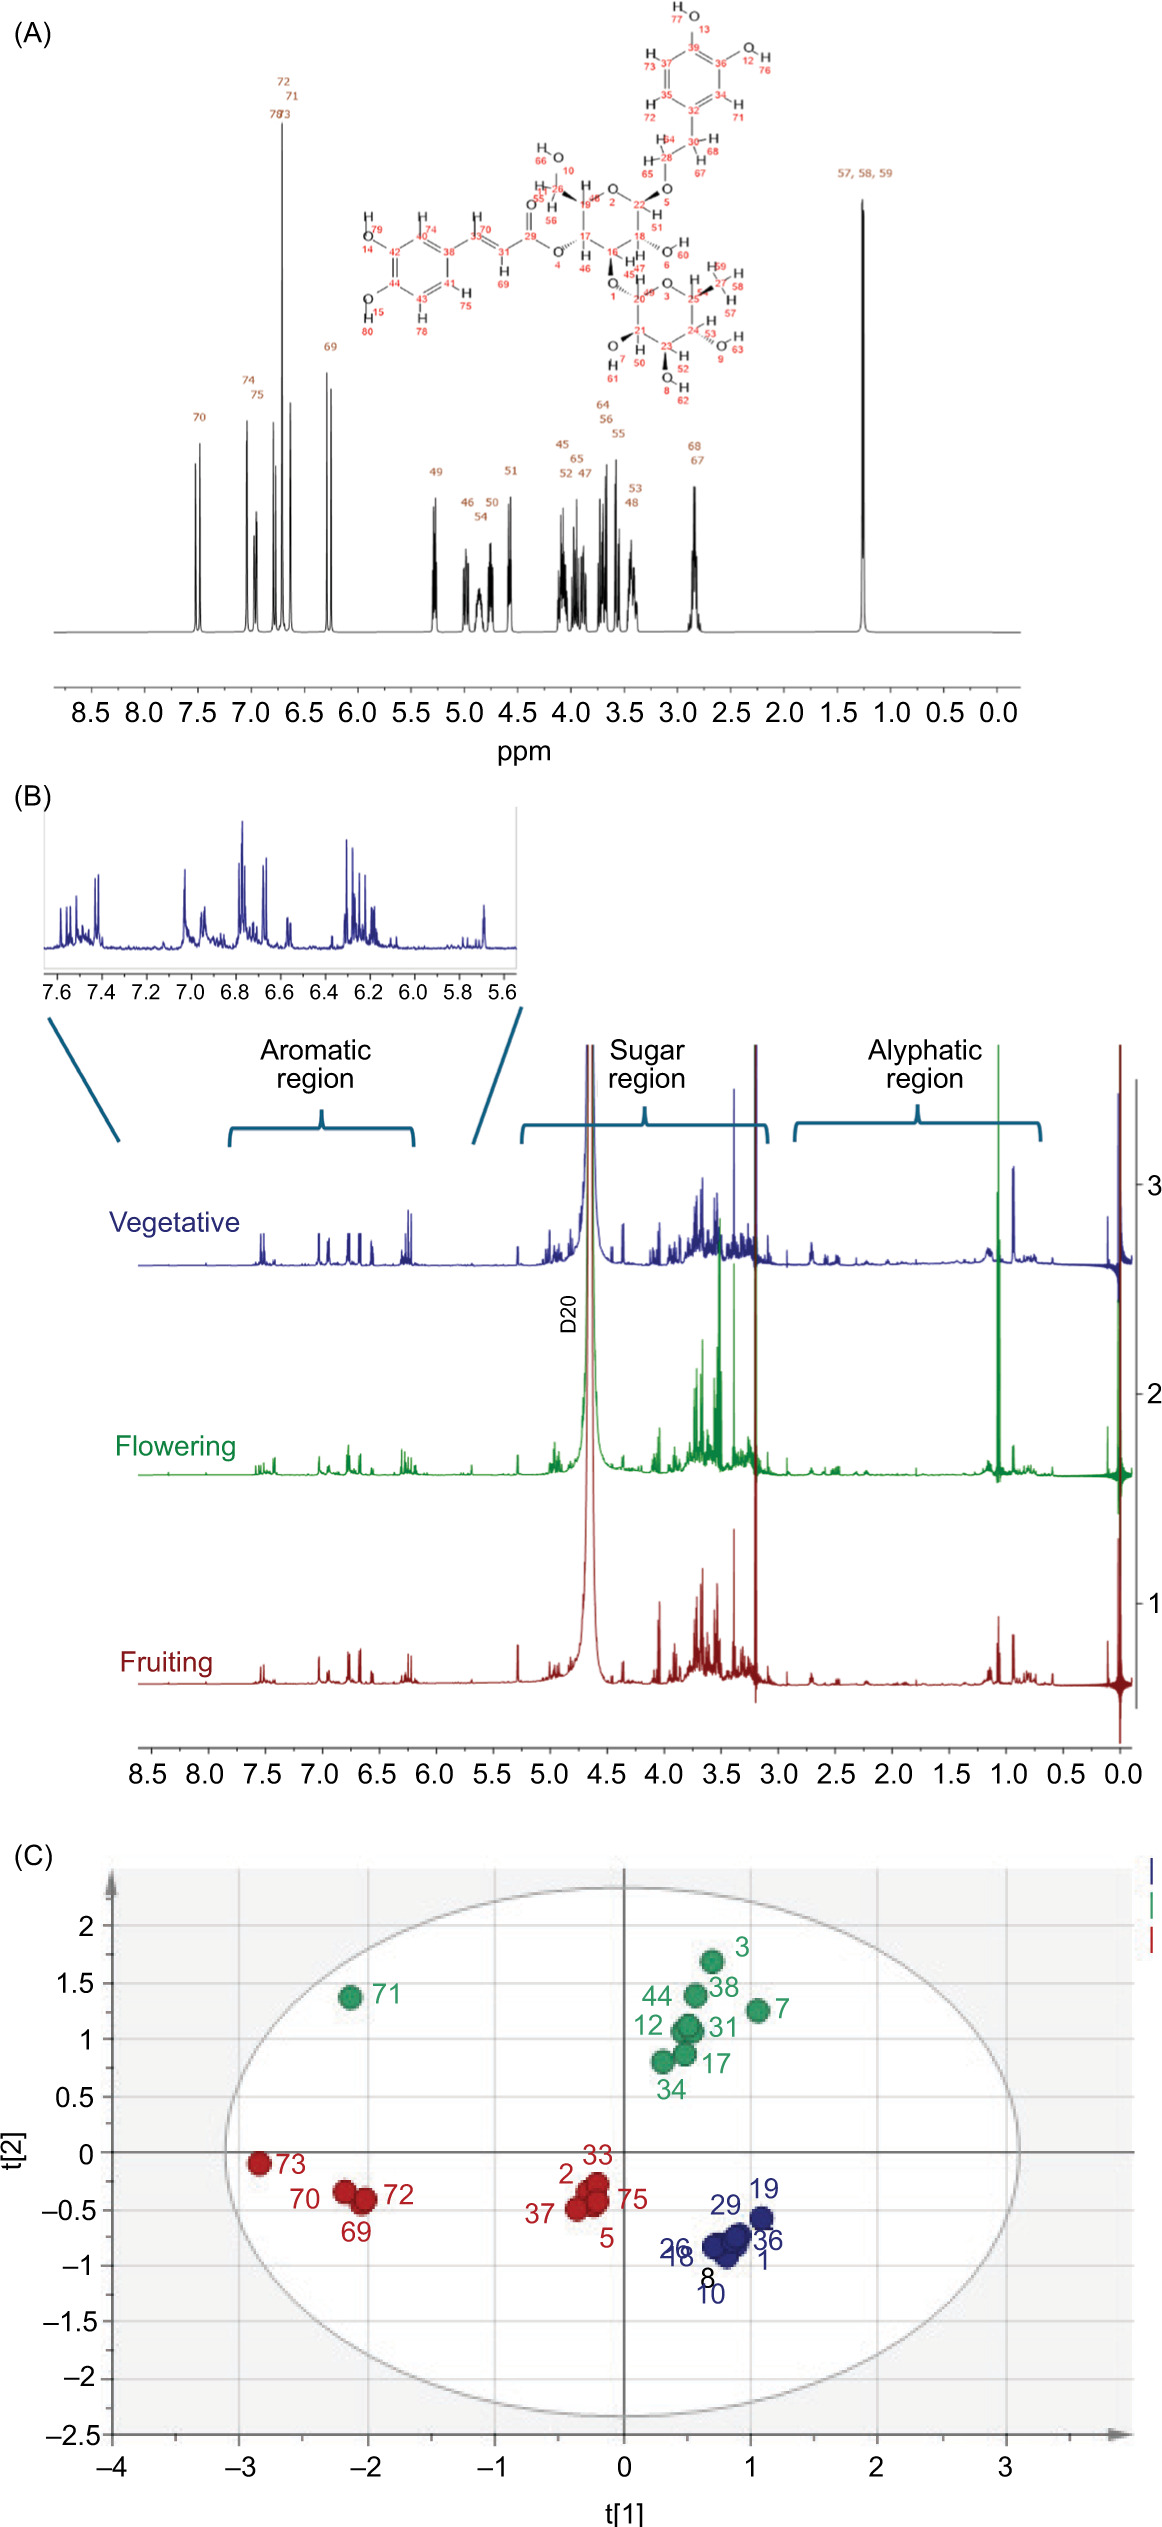
The metabolic fingerprint of the extracts of B. saligna (Willd.) was analyzed by 1HNMR to compare the chemical composition with respect to the phenological growth stages. Biologically active compounds are generally found in low concentrations in plants, whereas the primary metabolites are highly concentrated. The most abundant region was the sugar region, followed by the aromatic region, with samples collected during the flowering stage reporting higher signal peaks and samples collected during the fruiting stage reporting lower peaks (Figure 5B). Few peaks were observed in the aliphatic region, with larger signals for the samples collected during the fruiting stage (Figure 5B). Considering that verbascoside was the dominant constituent in all extracts, the most intense signals in the spectra originated from this compound. Figure 4A shows the simulated spectra of verbascoside reporting typical signals for two 1,3,4-trisubstituted aromatic rings belonging to a caffeoyl and a phenylethyl moieties as well as two anomeric sugar H, overlapping multiplets from the sugar protons in the d 3.1–4.2 range and at 0.97, compatible with a deoxy sugar. Comparison of the experimental spectra of extracts of B. saligna (Willd.) (Figure 5B) with the simulated spectrum showed that the signals between d 6.2 and 6.4 and between d 6.8 and 7.1 could be assigned to verbascoside. The data agreed with the earlier studies of Olivier et al. (2010) and Nina et al. (2024). The aromatic region of the 1H-NMR spectrum (d 6-10) was thus selected for the multivariate analysis. The PCA showed a clear separation between extracts obtained from different phenological growth stages (Figure 5C).
Figure 5. 1H-NMR spectra (solvent used CH3OH-d4 and D2O [KH2PO4 buffer, pH 6.0] at 600 MHz) and PCA scores plot of phenological stages of B. saligna (Willd.). (A) Verbascoside simulated spectrum; (B) Stacked spectra of flowering, fruiting, and vegetative extracts; and PCA scores plot-vegetative (blue), flowering (green), fruiting (red); (C) PCA scores plot-vegetative (blue), flowering (green), fruiting (red).
Conclusion
This study shows that the phytochemical and biological activity of B. saligna (Willd.) was influenced by the phenological growth stages and the applied extraction methods. Although some compounds were present at all phenological stages, their concentration changed significantly. Antioxidant compounds such as kaempferol, verbascoside, and luteolin were mainly present in samples collected during the flowering stage, while quercetin was prevalent in samples collected during the vegetative stage. Among the detected compounds, verbascoside is emerging as a promising nutraceutical due to its antioxidant and anti-inflammatory properties, offering new perspectives for its application in functional foods and dietary supplements aimed at promoting health and preventing chronic diseases. In addition, the extracts reported high antiproliferative activity against melanoma cell lines and low genotoxicity toward CHO-K1 cells. Overall, the results proved that harvesting B. saligna (Willd.) during the flowering stage was recommended to obtain extracts with the highest bioactivity.
Acknowledgment
This work was supported by the Open Access Publishing Fund of the Free University of Bozen-Bolzano.
Authors Contributions
All authors contributed equally to this article.
Funding
None.
Conflicts of Interest
None.
REFERENCES
Adedapo AA, Jimoh FO, Koduru S, Masika PJ, Afolayan AJ. Assessment of the medicinal potentials of the methanol extracts of the leaves and stems of Buddleja Saligna. BMC Complement Altern Med. 2009;9(21): 10.1186/1472-6882-9-21
Adegbaju OD, Otunola GA, Afolayan AJ. Effects of growth stage and seasons on the phytochemical content and antioxidant activities of crude extracts of Celosia Argentea L. Heliyon. 2020;6:e04086. 10.1016/j.heliyon.2020.e04086
Al-Naqeb G, Sidarovich V, Scrinzi D, Mazzeo I, Robbiati S, Pancher M, et al. Hydrochar and hydrochar co-compost from OFMSW digestate for soil application: 3. Toxicological evaluation. J Environ Manage. 2022;320:115910. 10.1016/j.jenvman.2022.115910
Amiri S, Motalebi Moghanjougi Z, Rezazadeh Bari M, Mousavi Khaneghah A. Natural protective agents and their applications as bio-preservatives in the food industry: An overview of current and future applications. Ital J Food Sci. 2021;33:55–68. 10.15586/ijfs.v33iSP1.2045
Angeli L, Morozova K, Scampicchio M. A kinetic-based stopped-flow DPPH method. Sci Rep. 2023;13:1–8. 10.1038/s41598-023-34382-7
Ashraf MA, Iqbal M, Rasheed R, Hussain I, Riaz M, Arif MS. Environmental stress and secondary metabolites in plants. In Plant Metabolites and Regulation Under Environmental Stress. Elsevier; 2018. p. 153–67. ISBN 9780128126899
Bamuamba K, Gammon DW, Meyers P, Dijoux-Franca M-G, Scott G. Anti-mycobacterial activity of five plant species used as traditional medicines in the Western Cape Province (South Africa). J Ethnopharmacol. 2008;117:385–90. 10.1016/j.jep.2008.02.007
Belwal T, Ezzat SM, Rastrelli L, Bhatt ID, Daglia M, Baldi A, et al. A critical analysis of extraction techniques used for botanicals: Trends, priorities, industrial uses and optimization strategies. TrAC. 2018;100:82–102. 10.1016/j.trac.2017.12.018
Bernardi M, Adami V, Albiero E, Madeo D, Rodeghiero F, Astori G. Absence of micronucleus formation in CHO-K1 cells cultivated in platelet lysate enriched medium. Exp Toxicol Pathol. 2014;66:111–6. 10.1016/j.etp.2013.11.001
Biswas A, Dey S, Xiao A, Huang S, Birhanie ZM, Deng Y, et al. Phytochemical content and antioxidant activity of different anatomical parts of Corchorus Olitorius and C. Capsularis during different phenological stages. Heliyon. 2023;9:e16494. 10.1016/j.heliyon.2023.e16494
Bouchareb A, Djemel A, Kadi I, Djemoui A, Bensouici C, Atanassova M, et al. Chemical profile, biological activities, and molecular docking of Algerian Juniperus Phoenicea berries. Ital J Food Sci. 2024;36:370–94. 10.15586/ijfs.v36i4.2729
Bouras Y, Atef C, Cherrada N, Gheraissa N, Chenna D, Chemsa AE, et al. Phytochemical profile and biological activities of Brassica oleracea var. elongata leaf and seed extracts: An in vitro study. Ital J Food Sci. 2024;36:193–207. 10.15586/ijfs.v36i4.2691
Boussoussa H, Khacheba I, Djeridane A, Mellah N, Yousfi M. Antibacterial activity from Rhanterium Adpressum flowers extracts, depending on seasonal variations. Ind Crops Prod. 2016; 83:44–47. 10.1016/j.indcrop.2015.12.020
Chau Nguyen TM, Gavahian M, Tsai P-J. Ultrasound-assisted extraction of gac (Momordica Cochinchinensis Spreng.) leaves: Effect of maturity stage on phytochemicals and carbohydrate-hydrolyzing enzymes inhibitory activity. Ital J Food Sci. 2021;33:34–42. 10.15586/ijfs.v33iSP1.1987
Chukwujekwu JC, Amoo SO, de Kock CA, Smith PJ, Van Staden J. Antiplasmodial, acetylcholinesterase and alpha-glucosidase inhibitory and cytotoxicity properties of Buddleja Saligna. S Afr J Bot. 2014;94:6–8. 10.1016/j.sajb.2014.05.003
Chukwujekwu JC, Rengasamy KRR, de Kock CA, Smith PJ, Slavětínská LP, van Staden J. Alpha-glucosidase inhibitory and antiplasmodial properties of terpenoids from the leaves of Buddleja Saligna Willd. J Enzyme Inhib Med Chem. 2016;31:63–6. 10.3109/14756366.2014.1003927
de Bono, J.S., Guo, C., Gurel, B., De Marzo, A.M., Sfanos, K.S., Mani, R.S., Gil, J., Drake, C.G., and Alimonti, A. 2020. Prostate Carcinogenesis: Inflammatory Storms. Nature Reviews Cancer. 2020;20:455–69. 10.1038/s41568-020-0267-9
Deb PK, Sarkar B. Seasonal variation of verbascoside as a principal phenolic compound linked with antioxidant potentials of Clerodendrum Glandulosum Lindl. leaves. Nat Prod Res. 2022;36:4415–9. 10.1080/14786419.2021.1979542
Dhanani T, Shah S, Gajbhiye NA, Kumar S. Effect of extraction methods on yield, phytochemical constituents and antioxidant activity of Withania Somnifera. Arab J Chem. 2017;10:1193–9. 10.1016/j.arabjc.2013.02.015
Dizdaroglu M, Jaruga P. Mechanisms of free radical-induced damage to DNA. Free Radic Res. 2012;46:382–419. 10.3109/10715762.2011.653969
Duh PD, Yen GC, Yen WJ, Chang LW. Antioxidant effects of water extracts from barley (Hordeum Vulgare L.) prepared under different roasting temperatures. J Agric Food Chem. 2001; 49(3): 1455–63. 10.1021/jf000882l
Farhadi N, Babaei K, Farsaraei S, Moghaddam M, Ghasemi Pirbalouti A. Changes in essential oil compositions, total phenol, flavonoids and antioxidant capacity of Achillea Millefolium at different growth stages. Ind Crops Prod. 2020;152:112570. 10.1016/j.indcrop.2020.112570
Feduraev P, Chupakhina G, Maslennikov P, Tacenko N, Skrypnik L. Variation in phenolic compounds content and antioxidant activity of different plant organs from Rumex Crispus L., and Rumex Obtusifolius L. at different growth stages. Antioxidants. 2019;8:237. 10.3390/antiox8070237
Fonmboh DJ, Abah ER, Fokunang TE, Herve B, Teke GN, Rose NM, et al. An overview of methods of extraction, isolation and characterization of natural medicinal plant products in improved traditional medicine research. AJRMPS. 2020;9(2): 31–57. 10.9734/ajrimps/2020/v9i230152
Gasparini A, Ferrentino G, Angeli L, Morozova K, Zatelli D, Scampicchio M. Ultrasound assisted extraction of oils from apple seeds: A comparative study with supercritical fluid and conventional solvent extraction. IFSET. 2023;86:103370. 10.1016/j.ifset.2023.103370
Gupta N, Verma K, Nalla S, Kulshreshtha A, Lall R, Prasad S. Free radicals as a double-edged sword: The cancer preventive and therapeutic roles of curcumin. Molecules. 2020;25:5390. 10.3390/molecules25225390
Kalın P, Gülçin İl, Gören AC. Antioxidant activity and polyphenol content of cranberries (Vaccinium Macrocarpon). Rec Nat Prod. 2015;9:496–502.
Khodabande Z, Jafarian V, Sariri R. Antioxidant activity of Chelidonium Majus extract at phenological stages. Appl Biol Chem. 2017;60:497–503. 10.1007/s13765-017-0304-x
Kocabey N, Yilmaztekin M, Hayaloglu AA. Effect of maceration duration on physicochemical characteristics, organic acid, phenolic compounds and antioxidant activity of red wine from Vitis Vinifera L. karaoglan. J Food Sci Technol. 2016;53:3557–65. 10.1007/s13197-016-2335-4
Lefebvre T, Destandau E, Lesellier E. Selective extraction of bioactive compounds from plants using recent extraction techniques: A review. J Chromatogr A. 2021;1635:461770. 10.1016/j.chroma.2020.461770
Mabusela MM, Matsiliza-Mlathi B, Kleynhans R. Phenological growth stages of Buddleja Saligna Willd. according to the BBCH scale. Plants. 2024;13:3542. 10.3390/plants13243542
Maree JE, Viljoen AM. Phytochemical distinction between Pelargonium Sidoides and Pelargonium Reniforme–A quality control perspective. S Afr J Bot. 2012;82:83–91. 10.1016/j.sajb.2012.07.007
Margraf T, Karnopp AR, Rosso ND, Granato D. Comparison between Folin-Ciocalteu and Prussian blue assays to estimate the total phenolic content of juices and teas using 96-well microplates. J Food Sci. 2015;80(11): C2397–403. 10.1111/1750-3841.13077
Mosibo OK, Scampicchio M, Ferrentino G. Calorimetric adaptation of the inhibited autoxidation method to determine the activity of individual antioxidants and natural extracts. J Therm Anal Calorim. 2022;147:12829–36. 10.1007/s10973-022-11399-0
Ncube B, Finnie JF, Van Staden J. Seasonal variation in antimicrobial and phytochemical properties of frequently used medicinal bulbous plants from South Africa. S Afr J Bot. 2011;77:387–96. 10.1016/j.sajb.2010.10.004
Nina N, Burgos-Edwards A, Theoduloz C, Tripathy S, Matsabisa M G, Schmeda-Hirschmann G. Chemical profiling, enzyme inhibitory activity and antioxidant capacity of South African herbal teas: Buddleja saligna, Lippia javanica, L. scaberrima and Phyla dulcis. Antioxidants. 2024;13:1219. 10.3390/antiox13101219
OECD Test No. 487: In Vitro Mammalian Cell Micronucleus Test, OECD Guidelines for the Testing of Chemicals. OECD publishing: Paris; 2023. ISBN 9789264264861
Olivier DK, Shikanga EA, Combrinck S, Krause RWM, Regnier T, Dlamini TP. Phenylethanoid glycosides from Lippia javanica. S Afr J Bot. 2010;76:58–63. 10.1016/j.sajb.2009.07.002
Panda D, Manickam S. Cavitation technology–the future of greener extraction method: A review on the extraction of natural products and process intensification mechanism and perspectives. Appl Sci. 2019;9:766. 10.3390/app9040766
Patel M, Dave K, Patel P. A review on different extraction method of plants: Innovation from ancient to modern technology. IJBPAS. 2021;10:511–27. 10.31032/IJBPAS/2021/10.12.1044
Rahali N, Mehdi S, Younsi F, Boussaid M, Messaoud C. Antioxidant, α-amylase, and acetylcholinesterase inhibitory activities of Hertia Cheirifolia essential oils: Influence of plant organs and seasonal variation. Int J Food Prop. 2017;20(Supp. 2): 1–15. 10.1080/10942912.2017.1352597
Rasul MG. Conventional extraction methods use in medicinal plants, their advantages and disadvantages. IJBSAC. 2018;2:10–14.
Sharifi-Rad M, Pohl P, Epifano F, Zengin G, Jaradat N, Messaoudi M. Teucrium Polium (L.): Phytochemical screening and biological activities at different phenological stages. Molecules. 2022;27:1561. 10.3390/molecules27051561
Singh A, Venugopala KN, Khedr MA, Pillay M, Nwaeze KU, Coovadia Y, et al. Antimycobacterial, docking and molecular dynamic studies of pentacyclic triterpenes from Buddleja Saligna Leaves. J Biomol Struct Dyn. 2017;35:2654–64. 10.1080/07391102.2016.1227725
Tiago O, Maicon N, Ivan RC, Diego NF, Vinícius JS, Mauricio F, et al. Plant secondary metabolites and its dynamical systems of induction in response to environmental factors: A review. Afr J Agric Res. 2017;12:71–84. 10.5897/AJAR2016.11677
Topal M, Gulcin İ. Evaluation of the in vitro antioxidant, antidiabetic and anticholinergic properties of rosmarinic acid from rosemary (Rosmarinus Officinalis L.). Biocatal Agric Biotechnol. 2022;43:102417. 10.1016/j.bcab.2022.102417
Twilley D, Langhansová L, Palaniswamy D, Lall N. Evaluation of traditionally used medicinal plants for anticancer, antioxidant, anti-inflammatory and anti-viral (HPV-1) activity. S Afr J Bot. 2017;112:494–500. 10.1016/j.sajb.2017.05.021
Twilley D, Moodley D, Rolfes H, Moodley I, McGaw LJ, Madikizela B, et al. Ethanolic extracts of South African plants, Buddleja Saligna Willd., and Helichrysum Odoratissimum (L.) sweet, as multifunctional ingredients in sunscreen formulations. S Afr J Bot. 2021;137:171–182. 10.1016/j.sajb.2020.10.010
Venugopal R, Liu RH. Phytochemicals in diets for breast cancer prevention: The importance of resveratrol and ursolic acid. Food Sci Hum Well. 2012;1:1–13. 10.1016/j.fshw.2012.12.001
Xue F, Li C. Effects of ultrasound assisted cell wall disruption on physicochemical properties of camellia bee pollen protein isolates. Ultrason Sonochem. 2023;92:106249. 10.1016/j.ultsonch.2022.106249