
Download
PAPER
The impact of nutritional FoPL on Slovak consumer behavior: Insights from online Eye Tracking and FaceReader analysis
Adriana Rusková1, Jakub Berčík1,2, Filip Tkáč3, Katarína Neomániová1*
1Institute of Marketing, Trade and Social Studies, Faculty of Economics and Management, Slovak University of Agriculture, Nitra, Slovakia;
2Department of Psychology, Faculty of Economics and Management, Czech University of Life Sciences, Prague, Czech Republic;
3University Counselling and Support Centre, Slovak University of Agriculture, Nitra, Slovakia
Abstract
Promoting a healthy lifestyle is a primary objective for governments and the food sector, targeting increasing obesity rates through efficacious interventions. One method involves employing Front-of-Pack Labeling (FoPL) to convey explicit nutritional information. The primary objective of this study was to examine consumer reactions to determine their views toward clear information on FoPL, evaluating the effects both explicitly and implicitly through eye-tracking and face-reading technologies. A survey evaluated preferences for cereals, yoghurt, and protein bars, evaluating visual attention and emotional responses before and after the introduction of two types of FoPLs. The study concludes that nutritional labeling can effectively promote healthier eating habits, especially for cereals and protein bars.
Key words: consumer behavior, eye tracking, emotions, FaceReader, labeling, nutrition
*Corresponding Author: Katarína Neomániová, Institute of Marketing, Trade and Social Studies, Faculty of Economics and Management, Slovak University of Agriculture, Nitra, Slovakia. Email: [email protected]
Academic Editor: Prof. Paolo Fantozzi, Dipartimento di Scienze Agrarie, Alimentari ed Ambientali, Università di Perugia, Via S. Costanzo, 1-06126 Perugia, ltaly
Received: 24 November 2024; Accepted: 14 March 2025; Published: 1 July 2025
© 2025 Codon Publications
This is an Open Access article distributed under the terms of the Creative Commons Attribution-NonCommercial-ShareAlike 4.0 International (CC BY-NC-SA 4.0). License (http://creativecommons.org/licenses/by-nc-sa/4.0/)
Introduction
Consumers’ food purchasing decisions are influenced by their perceptions of healthy eating (Motoki et al., 2021). As there are no objective criteria to define healthy and unhealthy foods (Lobstein and Davies, 2009), it is challenging to guide society toward a balanced, healthy diet (Motoki et al., 2021). The issue of healthy eating has now become a trend in the lifestyle of Slovak consumers as well (Horská et al., 2022). Conscious consumer behavior in food choice also has a great impact on food producers, who are constantly motivated by their changing requirements, such as the availability of new raw materials and environmental or health requirements associated with new eating habits. In addition, several factors such as composition, packaging, nutritional labeling, country of origin, or benefits associated with consumption influence consumers in the shopping environment, convincing them that the product is “healthy” (Plasek et al., 2020).
Food nutritional value evaluation is intrinsically complicated, especially when juggling the demand for quick understanding with the requirement for thorough information. Although Front-of-Pack Labeling (FoPL) systems are designed to make this procedure easy, there are issues with its use, particularly for customers with specific dietary requirements (Tarabella and Voinea, 2013). Although these labels provide a clear summary of a product’s healthfulness, they could leave out important details such as the quantity of micronutrients, the way the food has been processed, and its bioavailability. In the case of complex foods, when a standardized score might not accurately represent subtle nutritional trade-offs, this dichotomy between immediacy and completeness becomes especially pertinent (Martini et al., 2022).
Additionally, people who are managing medical disorders such as diabetes or cardiovascular diseases need accurate dietary advice, which simplified labeling schemes might not always provide. These issues must be addressed for FoPL frameworks to effectively meet a variety of consumer demands without oversimplifying dietary counsel (Graham et al., 2023; Shangguan et al., 2019).
To help consumers make more informed product choices and guide their purchasing decisions toward healthier food choices, the European Union has introduced various forms of labeling for food product packaging (Cecchini and Warin, 2016; De Bauw et al., 2021; Rønnow, 2020; Temple, 2020). We can also confirm that there is a growing interest in easy-to-understand nutritional indicators among today’s consumers (Devaux et al., 2024). Potential types of harmonized mandatory nutritional indicator labeling of food packaging within the European Union include the NutriScore scale, an endorsement logo (Keyhole), a color-coded nutrient-specific label (e.g., Multiple Traffic Lights), and noncolored nutrient-specific label (NutrInform Battery), which are further described by Devaux et al. (2024) in their study. One type of nutritional indicator that is gaining popularity is the French FoPL NutriScore. It aims at guiding (motivating) consumers to choose healthier alternatives based on a simple intuitive system consisting of five colors and letters (Gabor et al., 2020). In addition, the Nutrinform is a nutrient-specific labeling based on the reference labeling with the battery symbol and is one of the nondirective labels compared to the NutriScore (Savov et al., 2022).
The issue of front-of-package nutrition labeling among Slovak consumers is under-researched and requires further specialized studies. In 2021, the first extensive study on a representative sample of the Slovak population was conducted, focusing on comparing two nutrition labeling systems, specifically NutriScore and Nutrinform, and their impact on consumer behavior. In this study, consumers first evaluated products without front-of-package nutrition labels and then the same products with nutrition labels. The results showed that both labeling systems led to changes in consumer behavior, with outcomes favoring the NutriScore system (Savov et al., 2022). Another study (Gažárová and Lenártová, 2024) also contributes to the scientific evidence supporting the implementation of NutriScore in Slovakia. The research aimed to demonstrate that NutriScore motivates consumers to choose foods with a healthier nutritional profile compared to the absence of nutritional labeling. The survey results showed that the graphical format of NutriScore helps consumers better assess the nutritional quality of foods, not only from the perspective of nutritional data but also by considering consumer and sociodemographic variables.
The comparison of the effectiveness of Nutrinform and NutriScore was also examined in a study involving a large, combined sample of respondents from 20 EU countries (Slovakia was excluded from the analysis due to an insufficient number of respondents). Overall, the results indicate that Nutrinform outperforms NutriScore in enhancing consumer subjective understanding and generates greater preference for the label (He et al., 2023). Another study (Mazzù et al., 2021) examining the impact of Nutrinform and NutriScore on consumers’ subjective understanding and preferences across various sociocultural contexts (7 EU countries) reached the same conclusions. The results suggest that Nutrinform effectively helps consumers understand information in a relevant way and shows minimal impact from sociocultural differences. Another comparative study explored how NutriScore and Nutrinform influence the food choices of consumers with specific nutritional needs. It found that Nutrinform may provide greater benefits in meeting these specific dietary requirements (Castellini et al., 2024). On the other hand, there are studies that show that NutriScore significantly outperformed Nutrinform across all objective understanding tasks (Fialon et al., 2023). Another study among Italian participants also showed that NutriScore is perceived as easier to use than Nutrinform and led to higher intentions to purchase nutritionally favorable products (Fialon et al., 2022). The superiority of the NutriScore FoPL compared to the other tested labels has also been confirmed in additional studies (Egnell et al., 2020; Pettigrew et al., 2023). The mentioned facts suggest that further research is required to compare the performance of the two FoPLs, examine the impact of Nutrinform and NutriScore on consumers’ subjective and objective understanding and preferences.
Based on the findings, this study also aims to examine the influence of FoPLs (NutriScore vs. Nutrinform) on customer decision-making in the Slovak market by incorporating biometrics techniques.
The number of studies using biometric approaches is steadily increasing, with eye tracking emerging as the most commonly employed method to examine consumer perceptions (Cong et al., 2023). The eye-tracking technique has gained popularity as a way to address the limitations of subjective reporting, which is prone to various biases and does not accurately reflect how nutrition labels are used in reality (Ma and Zhuang, 2021). Certain studies have utilized eye-tracking methods to determine which labels most effectively capture consumers’ attention, revealing that design elements and the FoPL placement play crucial roles (Ghosh et al., 2023). Studies using eye-tracking methods have also shown that FoPL effectively draw attention to nutritional information and increases the overall time people spend looking at such details. However, in some cases, FoPL can act as a shortcut, reducing the attention given to the more detailed information found on the Nutrition Facts Panel (Bix et al., 2015). The fact that eye tracking can be seen as a promising method for evaluating attention to nutritional labels in different scenarios is also supported by another study (Becker et al., 2015). This study findings demonstrate that FoPL are noticed more frequently and sooner than the mandated Nutrition Facts Panel. Notably, the use of color in FoPL heightened attention, while there was no evidence that coding information via facial icons had any effect on drawing attention. Bialkova et al. (2014) also incorporated an experimental choice task with eye-tracking methodology in their study. They explored the extent to which attention to nutrition labels influences consumer choice and how this impact varies across different label formats. Their findings indicated that visual attention plays a mediating role in how FoPL affects consumer decisions. Another eye-tracking study (Gabor et al., 2020) examined the impact of various FoPL labels on visual attention. The study concluded that a more directive FoPL, like NutriScore, demands less visual attention but results in overestimations of the nutritional quality of less healthy products within their category. All of the examples provided demonstrate that eye tracking is an effective method for determining how different FoPLs can capture consumer attention and subsequently influence their decision-making process.
The recent rise of open-source eye-tracking libraries has generated interest in moving costly and time-intensive eye-tracking studies from the lab to online platforms. Using a webcam as an eye-tracking tool has accelerated research, made it more convenient (data collection is no longer restricted by time or place), and reduced costs (van der Cruyssen et al., 2023). Using a participant’s computer webcam in a home environment, instead of an eye-tracking lab, is also assumed to replicate real-world conditions (Brockinton et al., 2022).
Automatic facial expression analysis is the second-most frequently used technique among biometric approaches (Cong et al., 2023). Automatic facial coding allows for a real-time analysis of emotional responses in a noninvasive and contact-free manner (Höfling and Alpers, 2023). In the existing literature, there is limited research on the measurement of facial expressions in response to nutrition information, and as far as we know, no study has yet explored the emotions triggered by NutriScore and Nutrinform. A study by authors (Laffan et al., 2024) marked the first attempt to use facial coding to assess people’s immediate emotional reactions to nudge-type interventions. The research employed automatic facial coding to investigate whether providing calorie information about an unhealthy popcorn snack would trigger negative emotional responses. The findings indicated that this technique could be valuable, especially in situations where an intervention successfully influences the desired behavior change.
This paper focuses on FaceReader, a tool classified under somatic biometric methods for capturing secondary brain activity through nonverbal facial muscle expressions of respondents (Berčík et al., 2024). FaceReader by Noldus is a validated software solution that leverages computer vision technology to identify facial expressions. Its growing popularity in academic research is due to its ability to speed up, scale, and lower the costs associated with analyzing facial emotions (Zhu et al., 2024). FaceReader is capable of addressing various issues related to the measurement of emotions, as it can recognize both individual and combined basic emotions, along with levels of arousal and valence (Landmann, 2023).
This study investigates how FoPLs affect Slovak consumers, using biometric technologies to analyze visual attention and emotional responses, clarifying how labels influence food choices.
Materials and Methods
Aim
The primary aim of the article is to analyze customer responses to ascertain their attitudes toward the provision of unambiguous information as a component of FoPL.
Ethical approval
Before performing the study, ethical approval was obtained from the Ethics Committee at the Slovak University of Agriculture in Nitra (SUA), registered under reference 2023–009.
Study design
The survey was performed from November 08, 2023, to February 07, 2024 and examined the consumer behavior of 1062 respondents. The respondents were recruited by MN Force Research, an external research agency. The respondents were separated into two groups since the study focused on two distinct nutritional FoPL designs. The technique included replicating studies conducted in other European nations with somewhat comparable aims (Egnell et al., 2020).
Stimulus
Cereals, yogurts, and protein bars were the three product categories examined to determine how FoPL affected consumer perception and decision-making. Three variants with different ingredient combinations were considered in each category. The original edition reflected traditional goods that were frequently consumed by Slovak customers and had a straightforward composition. To assess differences in nutritional perception, the second edition consisted of goods with altered contents within the same category, and to assess how customers would react to intricate formulations, the third iteration featured products with the most varied compositions, combining a wider variety of substances. The mix of macronutrients and micronutrients, ingredient variety, and processing variations were among the important aspects examined. In particular, the major source of variance in cereals was the amount of carbohydrates, especially sugar. Protein bars and other functional foods showed variability in fat, sugar, carbohydrate, and fiber levels, whereas yogurts showed changes mostly in fat and sugar content. It is crucial to remember that during the study, participants were not given the chance to thoroughly review the component lists or nutritional data. Their evaluations were not based on a thorough examination of compositional specifics but rather on their first impressions of the product’s overall appearance and FoPL. This restriction was made purposefully to mirror real-world decision-making situations in which buyers frequently depend on front-of-pack indicators rather than carefully reading ingredient lists (Braesco and Drewnowski, 2023). Together with the controlled exposure to FoPL, this organized classification offered a clear framework for comprehending how varying degrees of product complexity affect customer decisions and emotional responses. We were able to investigate how FoPL influences consumers’ perceptions of product healthfulness and preference formation in a realistic shopping setting by concentrating on significant macronutrient variances within each category (Dubois et al., 2021).
To make decisions in the real world, where consumers frequently prioritize on front-of-pack cues, respondents were unable to read ingredient lists and instead relied on their quick assessment of FoPL and overall product look. It was possible to analyze how different product complexity affects consumer choices, healthfulness perceptions, and preference development; thanks to this organized categorization and controlled FoPL exposure.
Data collection
Survey research forms the foundation for analysis. The survey investigated consumer behavior in the Slovak food market on the perception and impact of FoPL on the nutritional composition of food items. The poll had a sample of 1062 respondents, who were randomly divided into two groups. The distribution of subsamples is displayed in Table 1.
Table 1. Research sample description.
| Sample – NI | Sample – NS | Sample – NI | Sample – NS | ||
|---|---|---|---|---|---|
| Gender | Region | ||||
| Man | 49.32% | 49.65% | SK-BL | 9.33% | 9.89% |
| Woman | 50.68% | 50.35% | SK-TA | 10.65% | 10.83% |
| Age | SK-TC | 10.65% | 11.33% | ||
| 18–29 | 26.12% | 25.14% | SK-NI | 15.63% | 14.44% |
| 30–49 | 3.23% | 34.24% | SK-BC | 13.45% | 11.32% |
| 50–64 | 21.31% | 22.35% | SK-ZI | 14.65% | 15.52% |
| 65+ | 21.34% | 18.27% | SK-PV | 14.32% | 14.98% |
| SK-KI | 11.32% | 11.69% | |||
| Size of municipality | Education | ||||
| <5000 | 18.36% | 18.90% | ISCED 0-2 | 4.11% | 3.45% |
| <20,000 | 25.54% | 27.65% | ISCED 3C | 28.36% | 29.92% |
| <100,000 | 32.45% | 29.98% | ISCED 3A/B | 38.41% | 37.98% |
| >100,000 | 23.65% | 23.47% | ISCED 5+ | 29.12% | 28.65% |
Biometric analysis
The respondents were divided into two groups, each of which evaluated the approaches to FoPL designed to improve the nutritional composition of food products. The first group was provided with comprehensive information regarding the contents of essential nutrients. Conversely, the objective of the second one was to demonstrate nutritional quality in the most straightforward manner feasible.
The analysis was performed using two complementary methodologies: First, a quantitative assessment of a consumer questionnaire, utilizing statistical techniques to extract insights from the gathered responses; and second, a mixed analysis of biometric data, specifically acquired through online eye-tracking and face-reading techniques, which offers a more profound comprehension of consumer behavior by examining their physiological responses. The research attempts to enhance the robustness of its results by merging various methodologies, which provides a holistic view of consumer choices and emotional reactions.
The platform Samo-lab.online uses a camera to detect eye movements and facial expressions, enabling remote tracking of respondents’ visual attention and emotional reaction without the need for them to physically visit a lab. This platform was created at the Slovak University of Agriculture in Nitra. It utilizes WebGazer, which is implemented using JavaScript in the web interface of the page shown in the browser. This allows the platform to analyze the eye gaze from the video while the stimuli are being seen. The license for this solution is provided at no cost (WEBGAZER, no date). This software was developed by the Dutch business, Noldus. Another study (van der Cruyssen et al., 2023) confirmed the reliability of open-source eye-tracking libraries. They demonstrated that online eye-tracking studies, which do not demand exceptional accuracy, can be conducted using a participant’s webcam, particularly for studies involving four or fewer significant areas of interest (AOIs). The acquired data were imported for heat map generation (Bargary et al., 2017; Goettker and Gegenfurtner, 2021). Based on the collected data, we generated AOIs according to the standards defined by Holmqvist (2011), taking into account the accuracy and quality of the data as well as the specificity of the visual stimuli, thus ensuring the relevance and accuracy of the analyzed areas (Hessels et al., 2016; Mahanama et al., 2022).
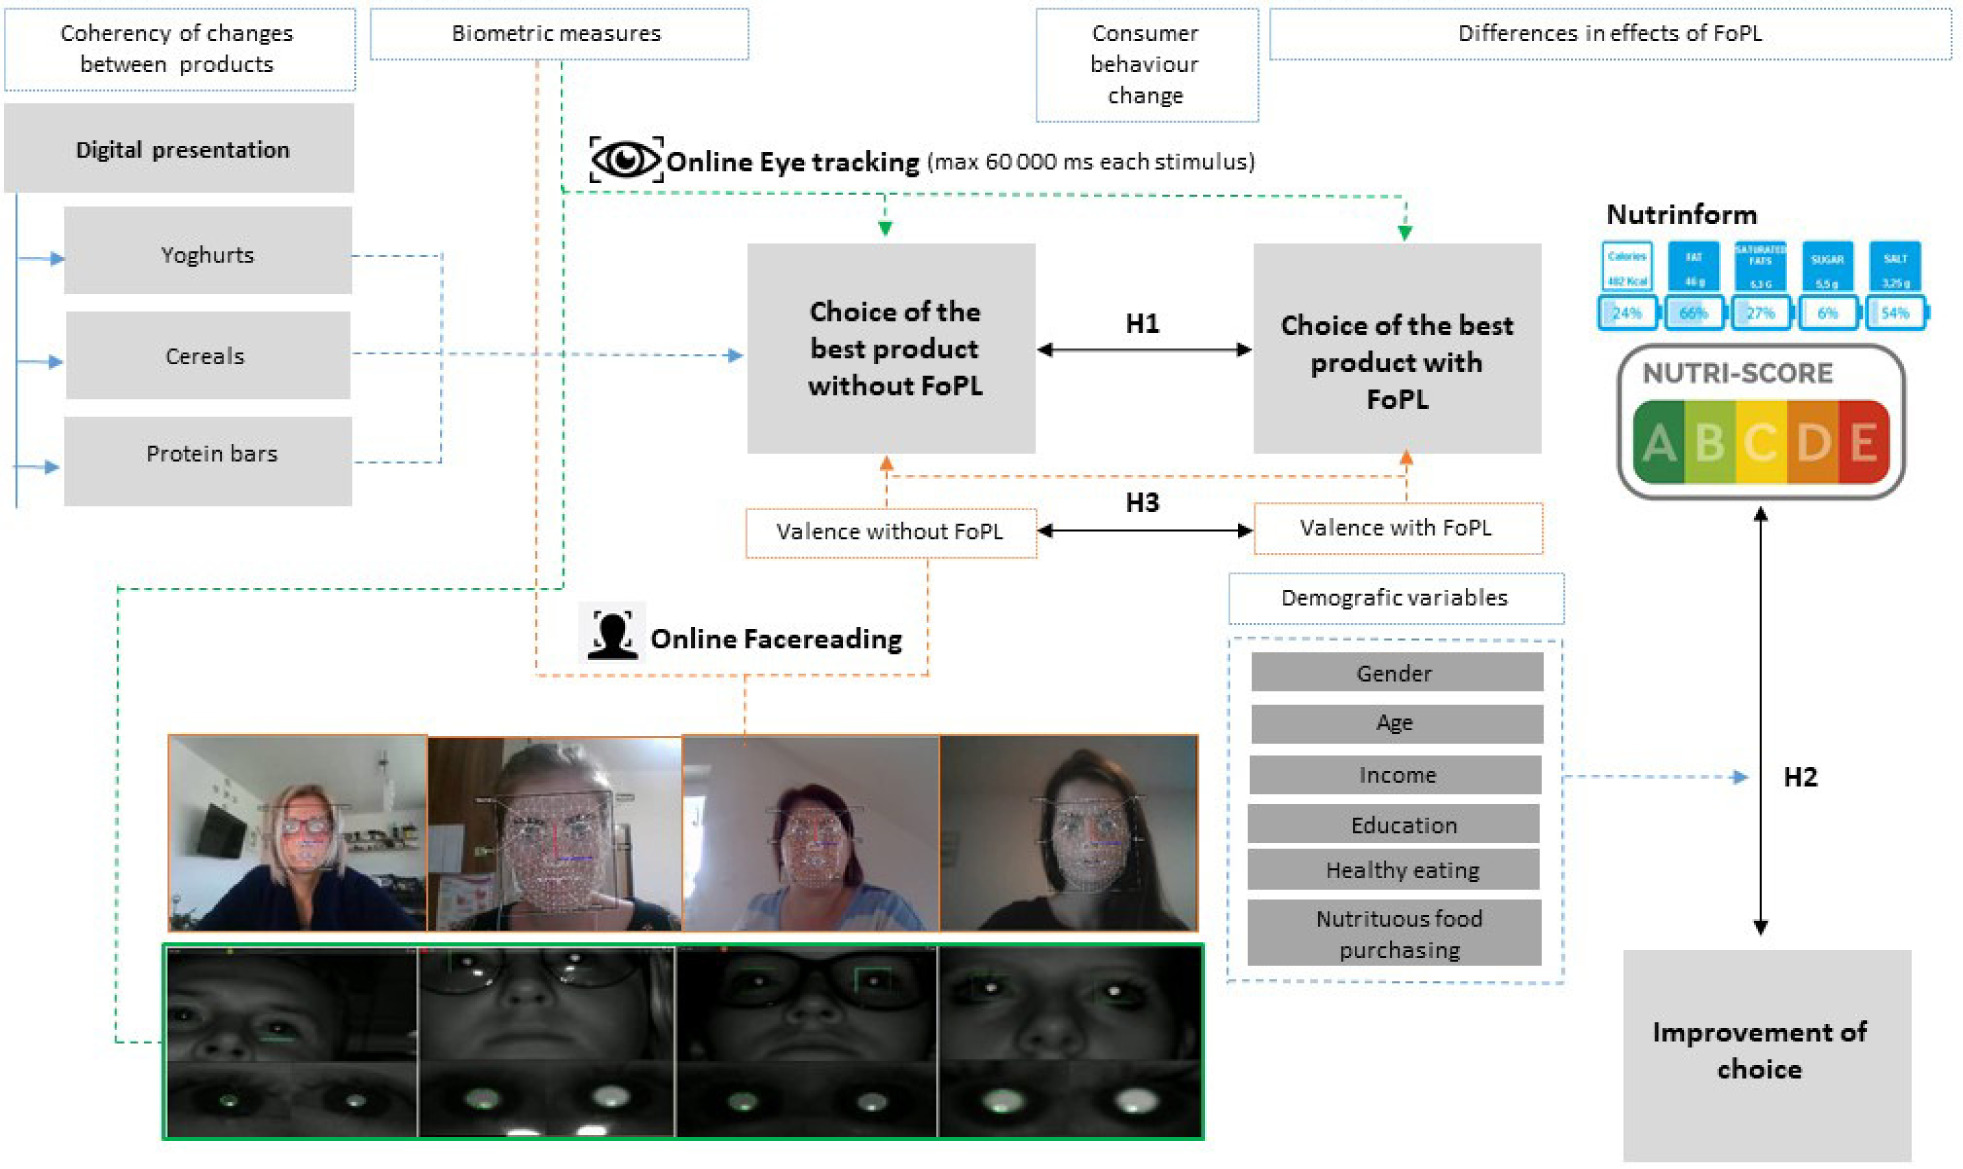
Simultaneously, the platform captures a video of the respondent’s face, which is then analyzed using an external application called FaceReader 7, which is a neuromarketing technology that examines customer behavior by detecting facial emotions and changes in pupil dilation. This enables the collection of implicit feedback from individuals (Berčík et al., 2020). The program has the ability to accurately detect six fundamental emotions: happy, sad, anger, surprise, fear, and disgust, with a precision rate of up to 90% (Loijens and Krips, 2013; Yu and Ko, 2017). The system examines the participant’s facial expressions while they see the stimuli on the screen, generating a grid of points that monitors changes in facial expressions indicative of emotional responses. Various elements, such as the presence of spectacles or beards, might have an impact on the accuracy and reliability of the collected data (Noldus, 2021). This technique enables the assessment of real-world phenomena and is often used as a supplementary approach to analyze consumer responses (Adamcyzk and Kuźmicz, 2021; Maison and Pawłowska, 2017; Atli, 2020). 759 respondents had their emotional valence data processed due to the lower quality of the recording, including the angle and lighting circumstances. Valence ranges from pleasant (1) to unpleasant (−1) and is calculated as the intensity of Happy minus the intensity of the negative emotion (i.e., Angry, Sad, Disgusted…) (Rutter et al., 2022). This dimension usually elicit approach and withdrawal behavior or behavioral tendencies, and activate the corresponding motor preparedness (Davidson, 1992; Bradley and Lang, 1994; Lang and Davis, 2006). The validity of the recorded data was mainly influenced by the scanning angle, the brightness of the environment, and the resolution of the recording device (Skiendziel et al., 2019). The testing method was conducted in accordance with the Code of Ethics of the “Laboratory of Consumer Studies” at the Faculty of Economics and Management of the Slovak University of Agriculture in Nitra and the Neuromarketing Science and Business Association. The principles outlined in the ICC/ESOMAR Code of Ethics were also approved. Every participant was given a detailed explanation of the experimental process, underwent a brief instruction on the techniques employed (eye tracking and face reading), and filled out two forms that comply with the General Data Protection Regulation (GDPR). These forms included consent for biometric testing, processing, and storage of personal data, as well as an acknowledgment of completing the brief training. Participants were provided with a distinct URL link, which they had to access and provide their consent to undergo the testing, while also accepting all the terms and conditions associated with GDPR. Afterward, the camera was installed, and the participants were introduced to the testing procedure, which was preceded by a calibration process. In our instance, we conducted a 9-point calibration. After completing the basic setup and calibration, the responder was guided to the survey. During the survey, visual and emotional reactions were monitored while the stimuli were presented. The research design is shown in Figure 1.
Figure 1. Research design and testing hypotheses.
Hypotheses
Hypothesis 1 (H1): Front-of-Pack Labeling (FoPL) on product packaging has a significant effect on improving consumer choice of the best product.
Hypothesis 2 (H2): Demographic variables have a significant impact on changing consumers’ choice based on NutriScore FoPL.
Hypothesis 3 (H3): Front-of-Pack Labeling (FoPL) has a significant influence on the valence of respondents’ emotions.
Statistical analysis
To assess the impact of FoPL on customer choice, we used the Marginal Homogeneity Test. This test is suitable for analyzing paired nominal data, such as customer decisions before and after being exposed to FoPL. We gathered data on customer preferences before and during the implementation of FoPL and created a contingency table to depict these options. We used the Marginal Homogeneity Test to examine the marginal distributions of customer decisions across several categories. An important outcome would suggest that the FoPL caused a statistically significant change in customer preferences.
Next, we used the Z Test for ratios to analyze the differences in the proportion of customers that chose the best product improvements across various items and labels. This approach included computing the ratio of customers who selected the most optimal product improvements for each combination of product and label. Subsequently, we conducted a comparison of these proportions using the Z test for proportions to detect any notable disparities. This test enabled us to evaluate whether the proportion of customers choosing the most favorable product improvements differed considerably across various groups, suggesting differences in consumer preferences across items and labels.
We used the Principal Component Analysis (PCA) to investigate the correlations between customers’ selections of various items and labels. Principal Component Analysis (PCA) is a method used to reduce the number of dimensions in a dataset, allowing the identification of underlying patterns in large datasets. We gathered data on customer preferences for different goods and brands and then adjusted the data to ensure that each variable had an equal impact on the study. Through the use of PCA, we successfully derived the main components that effectively captured the highest amount of variation in customer preferences. Subsequently, these components were analyzed to uncover fundamental characteristics that elucidated the connections between customer preferences for various items and labels.
To examine the impact of demographic factors on shifts in consumer preferences using NutriScore, we used Multiple Linear Regression. The focal point of this investigation was the alteration in consumer selection, quantified by the disparity in choice scores or preferences before and after exposure to NutriScore. The independent variables in our study consisted of demographic factors, including age, gender, income, and education level. We evaluated the influence of these demographic characteristics on the observed variations in customer choice by using a multiple linear regression model. The model’s relevance and fit were assessed to examine the robustness of the association between demographic factors and changes in consumer preferences.
To examine variations in customer valence, such as contentment or emotional reaction, depending on Label and Product, we used the two-way ANOVA for Repeated Measures. Subsequently, we conducted post hoc testing using Bonferroni correction. This approach was used in an experimental configuration where identical consumers assessed different items under varying labeling settings, leading to multiple measurements for each participant. The two-way ANOVA enabled us to evaluate the primary impacts of Label and Product, as well as their interaction impact on customer valence. The ANOVA revealed significant effects, which were further analyzed using post hoc testing with Bonferroni correction. This analysis aimed to identify particular labels or items that had a substantial influence on valence while accounting for the possibility of Type I error resulting from multiple comparisons.
In order to assure the correctness and effectiveness of our statistical procedures, we used several software applications for the study. The statistical software R Studio was used for intricate statistical studies, such as the Marginal Homogeneity Test, PCA, Multiple Linear Regression, and the Two-Way ANOVA for repeated measures. The Z Test for ratios was conducted using XL STAT, an Excel add-in. This software offers a user-friendly interface that facilitates the administration of large datasets and simplifies the understanding of the obtained findings.
Furthermore, ChatGPT played a crucial role in automating several elements of data pretreatment and analysis, hence simplifying the workflow and improving the overall efficiency of the research process. To graphically depict the data, we used Flourish Studio to generate lucid and informative charts, hence assuring the successful communication of the findings.
Results
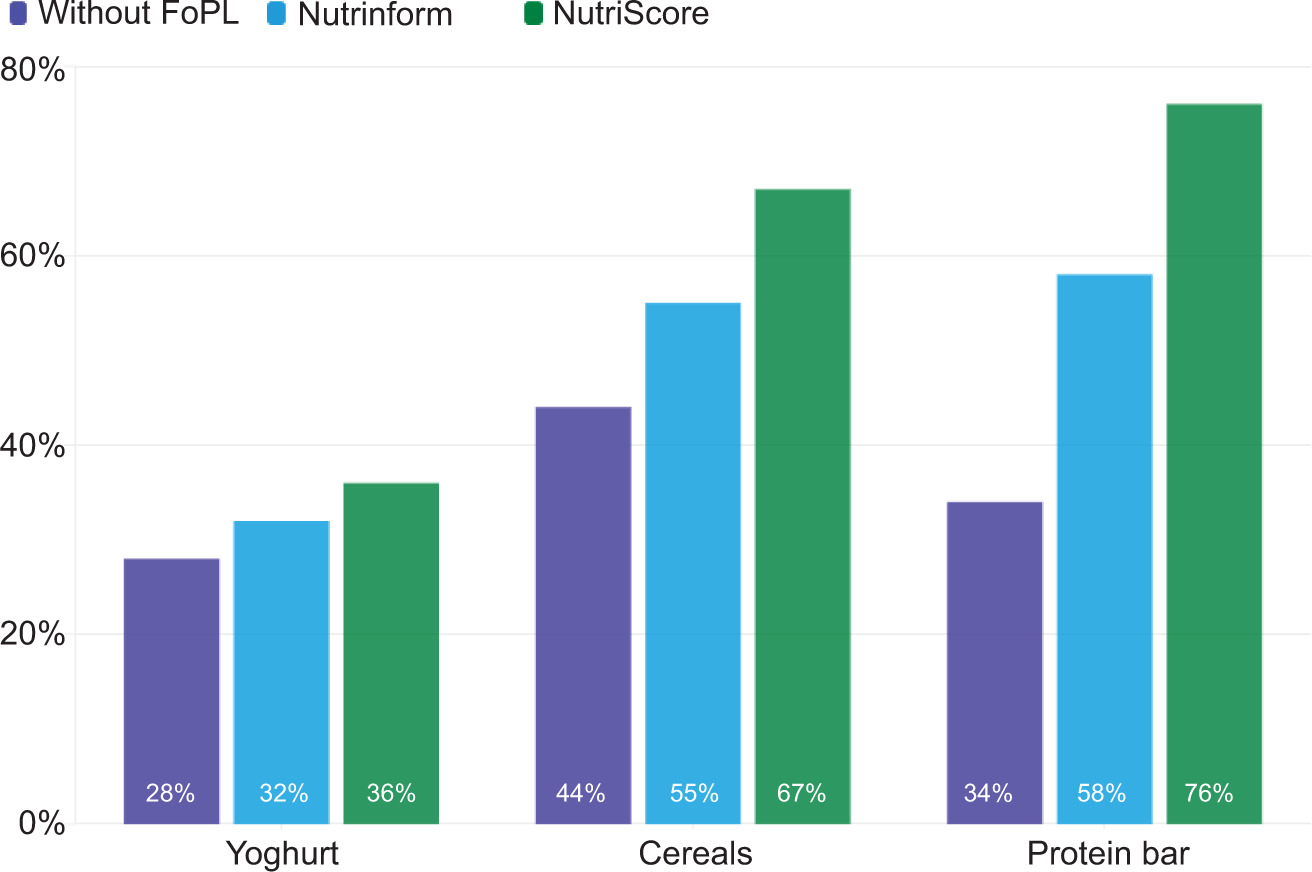
The initial objective of the research was to determine whether the use of FoPL in conjunction with nutritional information would lead to a more informed decision regarding the optimal product in three specified categories (i.e., that respondents choose the healthiest product option (the best product option is identical according to both indicators). The results are presented in Figure 2. FoPL on product packaging has a significant effect on improving consumer choice (Marginal Homogeneity Test, P = 3.05 × 10⁻⁷).
Figure 2. Share of respondents who have chosen the best option.
From a global perspective, we were unable to confirm a consistent, statistically significant difference between the impact of individual labels on improving consumer choice, but it is clear that the nature of the product also plays a role in the application of these indicators. The most notable disparities in consumer choice enhancements at the level of individual products are particularly visible in the case of protein bars. These disparities are also statistically significant, with NutriScore playing a substantial role in facilitating a more prominent improvement (Z-Test for ratios, 0.003).
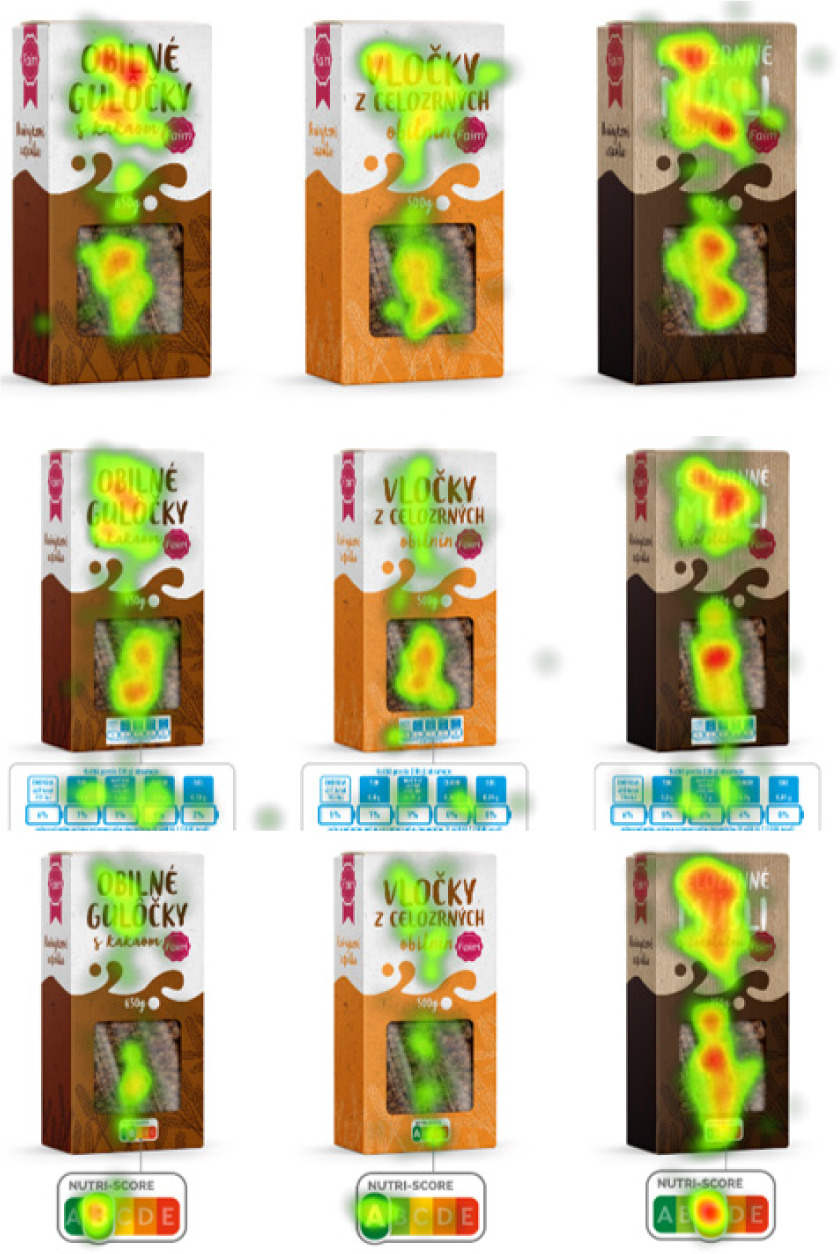
Furthermore, there are noticeable variations in visual attention when observing and choosing cereals, as seen in Figure 3. Respondents mostly directed their attention toward the product titles and the apparent locations of the actual cereal content for items without FoPL. Following the implementation of FoPL, there was a noticeable focus on the indices themselves, as seen by the heat maps. According to the AOI (Areas of Interest), shown in Table A1, it is evident that participants spent the most time observing the items branded with NutriScore (Total Fixation Duration: products 42.79 s and NutriScore 10.05 s), totaling 52.84 s. Across all three product perspectives, participants mostly directed their attention to the objects themselves. When evaluating the visual appeal of the nutritional indicators, it was shown that respondents recognized NutriScore more quickly (Time to First Fixation 2.95 s) compared to Nutrinform (Time to First Fixation 6.01 s). Similarly, the NutriScore indication received the longest initial attention, with a First Fixation Duration of 0.57 s. A noteworthy discovery is that cereals with FoPL NutriScore attracted more fixations, both on the indicator itself (1459 fixation count) and on the products (6519 fixation count), suggesting a potentially simpler comprehension of the NutriScore compared to Nutrinform. This indicated that respondents were able to associate nutritional quality with a specific cereal.
Figure 3. Heat map from online eye tracking – cereals.
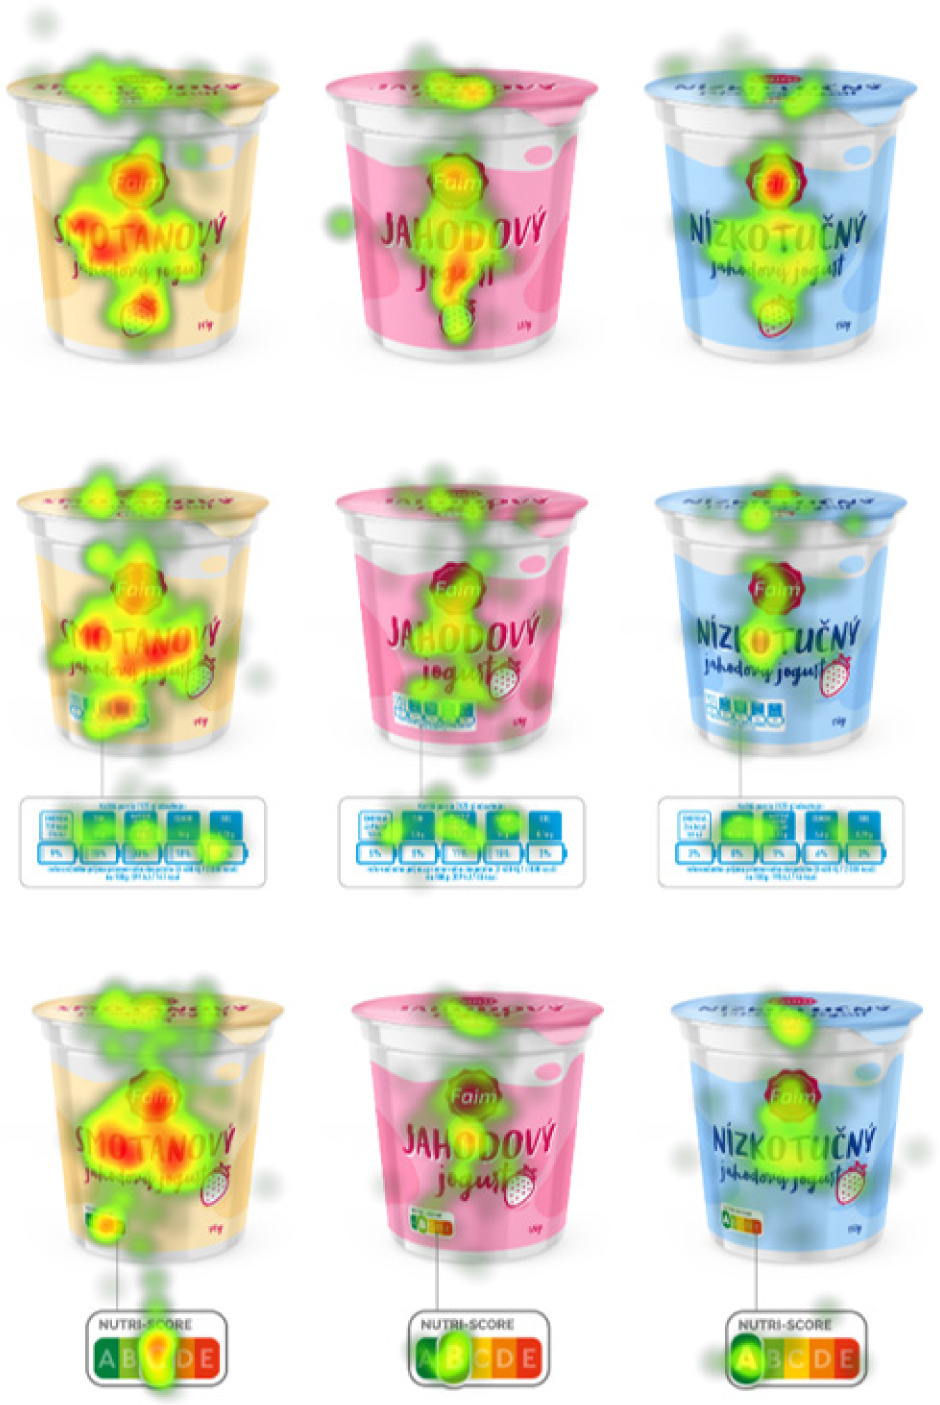
The heat map indicates that the cream yogurt received the highest level of visual attention in all three instances (Figure 4). Following the implementation of FoPL, there was a shift in visual attention toward the indices themselves, particularly focusing on the nutritional makeup of creamed yogurt. According to the AOI mentioned in Table A1, it is evident that the participants dedicated the most time to observing the Nutrinform labeled selection. The total duration of their focus on the items was 41.06 s, while their focus on Nutrinform was 10.98 s, resulting in a combined duration of 52.04 s. In all three instances of yogurt displays, both with and without FoPL, the participants mostly observed the items themselves. When comparing the visual appeal of the nutritional indicators, it is evident that NutriScore captured the respondents’ attention more quickly (Time to First fixation 2.73 s) compared to Nutrinform (Time to First fixation 5.28 s). The Nutrinform indications received the longest initial attention, with a First Fixation Duration of 0.43 s. Yogurts with FoPL NutriScore received more fixations (7786 fixation count) compared to Nutrinform (7685 fixation count). However, it is worth noting that more fixations were made on the Nutrinform indicator (1484 fixation count) compared to NutriScore (848 fixation count). This suggests that respondents may have a greater desire to understand the detailed nutritional composition of the yogurts.
Figure 4. Heat map from online eye tracking – yogurts.
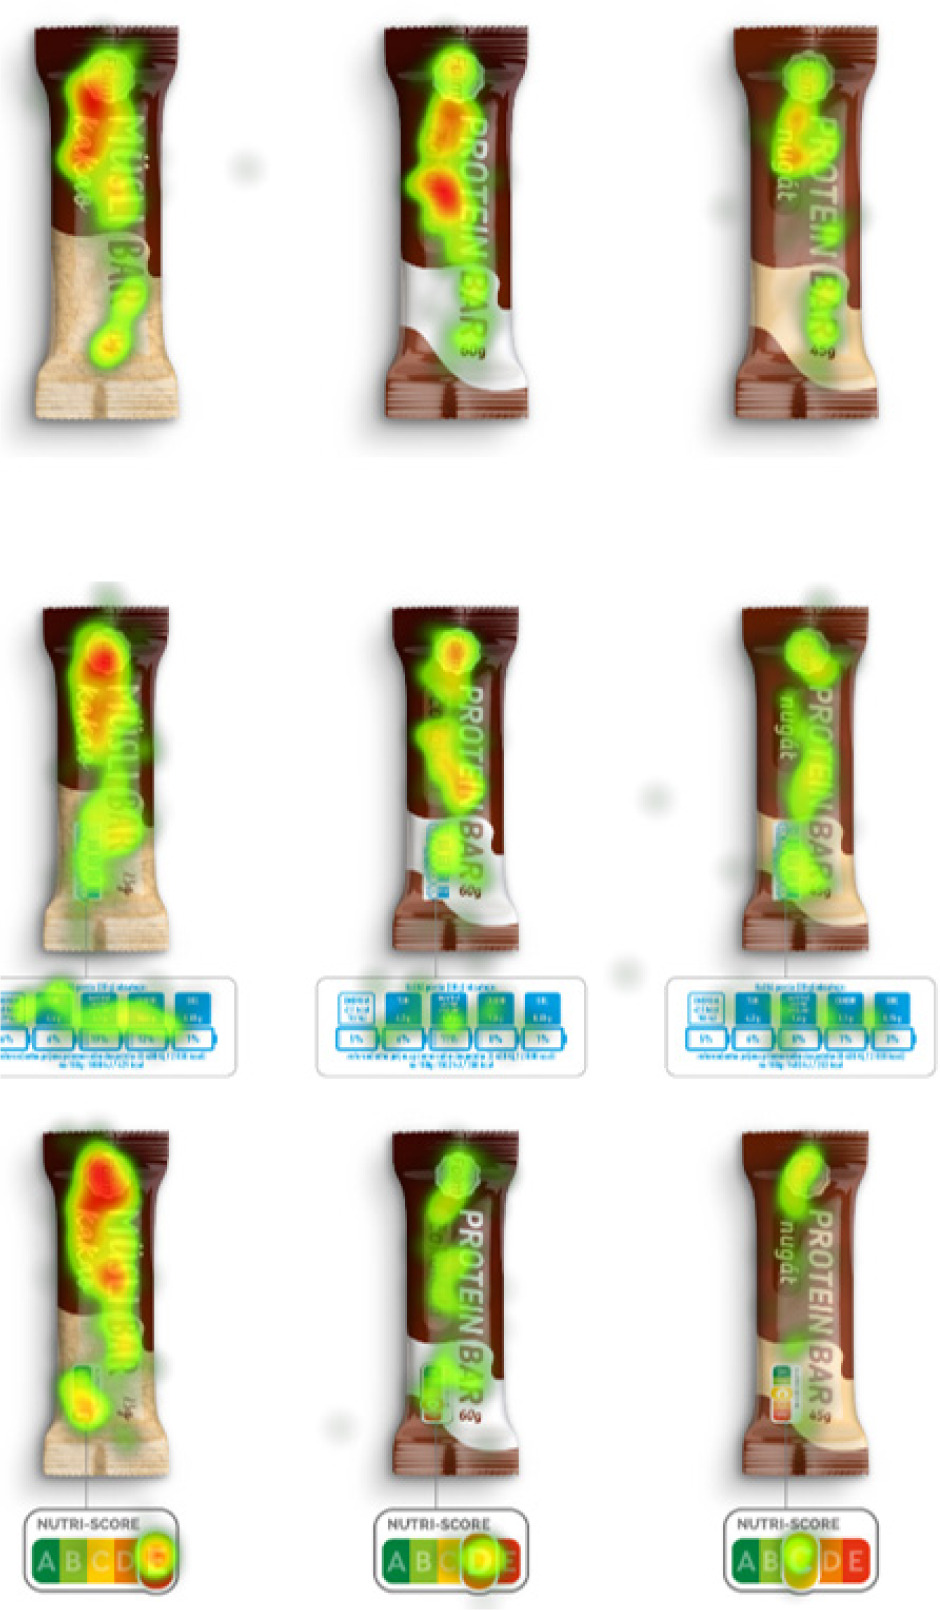
The muesli bar captured visual attention in all three instances (Figure 5). Following the implementation of FoPL, there was a shift in visual attention toward the indices. The majority of the gaze was directed toward the nutritional composition of the muesli bar. This might be attributed to the fact that the composition of this bar was the least nutritionally balanced. According to the AOI, as shown in Table A1, it is evident that respondents dedicated the most time to examining the options tagged with NutriScore (Total Fixation Duration: goods 44.35 s and NutriScore 6.87 s), totaling 51.22 s. Across all three perspectives of the functional bars, both with and without FoPL, participants mostly saw the goods themselves as their first focus. When comparing the visual appeal of the nutritional indicators, it can be concluded that in this situation, Nutrinform (with a Time to First Fixation of 2.93 s) captured the respondents’ visual attention quickly than NutriScore (with a Time to First Fixation of 5.75 s). The NutrInform indication received the longest first gaze, with a First Fixation Duration of 0.41 s. Bars with FoPL NutriScore received a higher number of fixations (7891 fixations on products and FoPL) compared to Nutrinform (7738 fixations on products and FoPL). However, when it comes to yogurt, more fixations were made on the Nutrinform indicator (1749 fixations) compared to NutriScore (1160 fixations), suggesting that Nutrinform may present a more challenging understanding of the nutritional composition.
Figure 5. Heat map from online eye tracking – Protein bar.
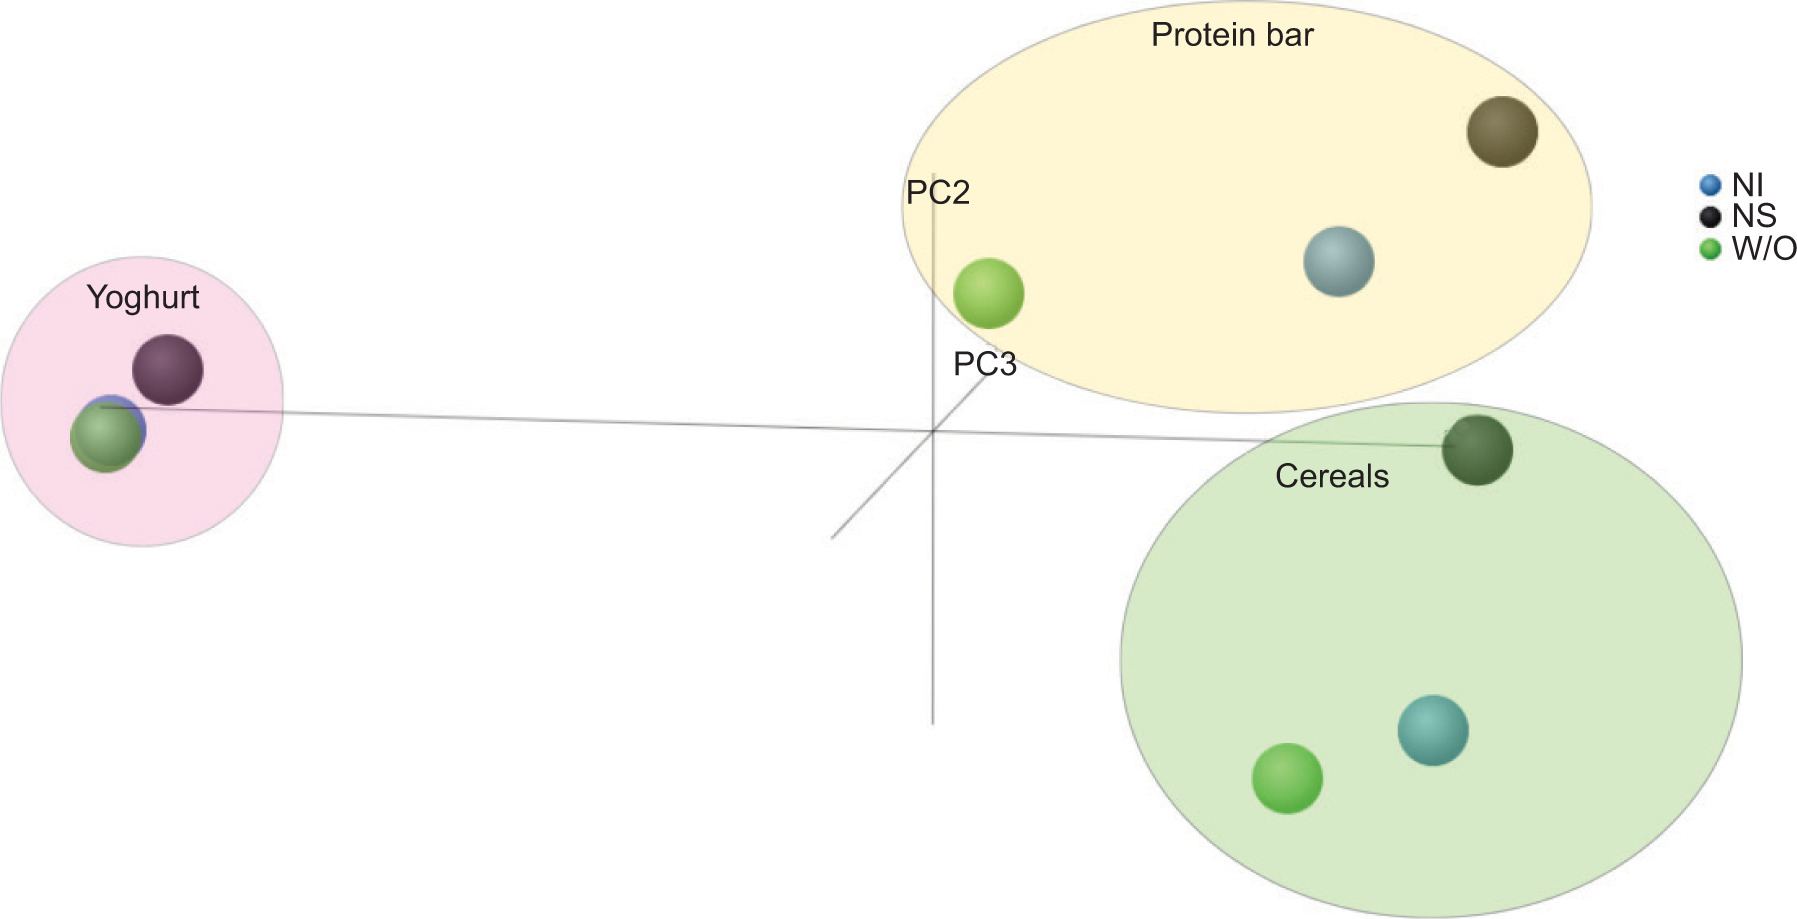
From the aforementioned data, the influence of FoPL seems to vary among various items. Figure 6 demonstrates that the component scores obtained from the principal component analysis reveal that the consumer’s preference for yogurt remains consistent across all three labeling scenarios. However, the most noticeable variations are observed in the case of protein bars. When it comes to cereals, the NutriScore variation attains a distinct significance. Simultaneously, it can be inferred from the aforementioned that there is no apparent cross-product impact in the selection. When comparing product categories, bars and cereals are mostly consumed by those who are interested in maintaining a healthy diet. The yogurt product category is well-recognized by all customers. This observation was also evident in the findings, as the preferences for cream yogurt were unaffected by any kind of FoPL. Slovaks consider cream yogurt to be a traditional delicacy that they enjoy for breakfast, during the day, or in the evening as a sweet treat while watching TV, without considering its nutritional content. Simultaneously, most customers consider cream yogurt as a more healthful option compared to low-fat yogurt. They contend that natural ingredients, such as cream, provide more benefits to human health than artificial sweeteners.
Figure 6. Relationships between consumers’ choices.
The method described above fails to acknowledge that the beneficial impact of the label might be seen as a movement in customer preference toward the most nutritious product, moving away from the least favorable option toward a slightly superior alternative. Hence, we examined alterations in consumer preferences using the approach developed by (Egnell et al., 2020). In this methodology, different versions of products were categorized on a 3-point scale, with 1 denoting the least favorable option in terms of nutrition and 3 representing the most favorable one. The product category score was then determined by comparing the choices made with and without FoPL. After using the aforementioned methods to calculate the score, we identified the following as dependent factors for individual items. We hypothesize that these variables may be stochastically influenced by independent factors such as gender, age, income, education, and the level of attention given to purchasing nutritious food might influence healthy eating habits. Our attention was only on the FoPL NutriScore. The results are presented in Table 2.
Table 2. Regression output for FoPL respondents’ choice score.
| Variable | Direction/Significance (P) | ||
|---|---|---|---|
| Protein bar | Yogurt | Cereals | |
| Gender | - | - | - |
| Age | - | - | - |
| Income | + (0.01) | - | + (0.03) |
| Education | + (0.01) | + (0.04) | |
| Healthy eating | + (<0.01) | + (<0.01) | + (<0.01) |
| Nutritious food purchasing | + (<0.01) | + (<0.01) | + (<0.01) |
The aforementioned findings indicate that fundamental demographic characteristics, such as gender and age, do not have a statistically significant impact on the score. In other words, they do not influence the change in customer choice for any of the three monitored items. Conversely, those who purchase nutritious items or have an interest in healthy eating are the ones who might perceive a favorable impact on consumer selection, namely a rise in ratings. The NutriScore indicator for protein bars and cereals is influenced by increased wealth and better education, resulting in an improvement in customer choice in terms of nutritional quality.
As previously said, those who are concerned about maintaining a healthy diet tend to consume cereals and bars more regularly. Typically, those with advanced education and a keen understanding of the negative effects of being overweight or obese, as well as those with a higher income, tend to exhibit more interest in consuming nutritious meals. This is partly because healthier food options often come with a higher price tag. Our results indicate that individuals with greater wealth and education are more likely to be influenced by NutriScore in shaping their buying choices.
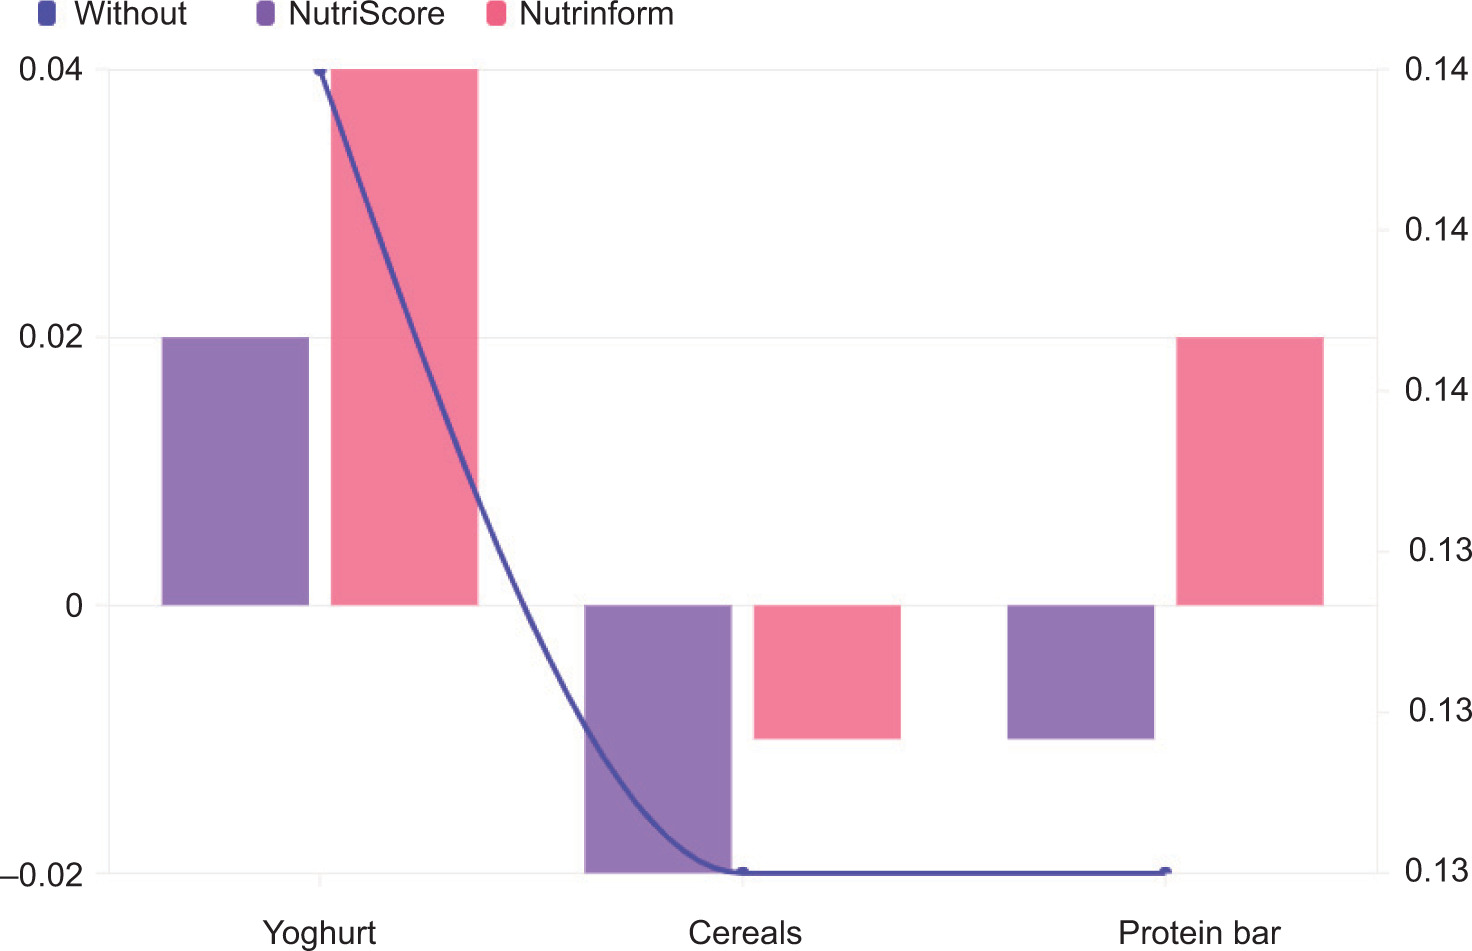
Upon analyzing the emotional polarity (valence) observed in Face-reading data during participants’ exposure to various product categories, both with and without FoPLs, it becomes apparent that disclosing information about the nutritional composition of products harmed respondents’ perceptions. The impact of this effect was most noticeable for goods that individuals seldom consumed, such as bars and cereals. Concurrently, it is evident that the NutriScore indication had a greater detrimental impact on the emotions of the participants, leading to a valence score of −0.02 for cereals and −0.01 for protein bars (Figure 7). Considering that the main objective of nutritional indicators is to influence consumer choices in favor of healthier alternatives, it can be deduced that NutriScore is more effective in achieving this aim for Slovak consumers compared to Nutrinform.
Figure 7. Average valence. The left vertical axis represents valences with FoPL, whereas the right vertical axis represents valences without FoPL.
The statistical investigation has shown that nutritional indicators have a substantial influence on the polarity of emotions, namely, the valence. Please refer to Table 3 for more details. The observed effect was evident irrespective of the product category, indicating that the specific product line did not have a statistically significant impact on emotional perception in terms of the polarity of emotion. Put simply, the respondents’ emotional reaction was unaffected by the particular kind of food but rather by whether or not nutritional information was included on the container. Simultaneously, there was no notable interaction impact seen between FoPL and product category for the polarity of feelings. This indicates that the impact of FoPL on the emotional response (valence) was the same across all items, independent of their kind.
Table 3. Two-factor analysis of variance for repeated measures – FoPL and Product influence on valence.
| Factor | F value | P |
|---|---|---|
| FoPL | 49.95 | 0.0015 |
| Product | 3.21 | 0.1473 |
| FoPL:Product | 0.24 | 0.9077 |
Through a post-hoc analysis, specifically a pairwise comparison with Bonferroni correction, we have shown (Table 4) a discernible difference in emotional perception between items presented without a label and those including either a NutriScore or Nutrinform label. The inclusion of nutritional indications on product packaging may have a substantial impact on customers’ emotional responses to a product. However, when comparing NutriScore and Nutrinform, there was no statistically significant difference in the emotional assessment of the two measures. Put simply, although both kinds of labeling may alter customers’ perceptions of items, there is no notable difference between them in terms of their impact on emotions.
Table 4. Differences of valence based on FoPL type.
| Group 1 | Group 2 | P | Reject null |
|---|---|---|---|
| NI | NS | 0.8852 | False |
| NI | WO | 0.0385 | True |
| NS | WO | 0.0494 | True |
Discussion
The present research sought to examine the influence of FoPLon customer decision-making in the Slovak market, using sophisticated biometric methodologies such as FaceReader and Eye tracker technology. The results of our study suggest that FoPLs, specifically the NutriScore, have a major impact on consumer decision-making. They help consumers identify healthier items more effectively and also change their emotional reactions toward these products. Ikonen et al. (2020) performed a meta-analysis and discovered that while FoPLs typically assist customers in recognizing healthier items, their capacity to encourage consumers to make better choices is somewhat restricted. This implies that while FoPLs such as NutriScore have the ability to capture people’s attention and provide information to customers, they may not be sufficient on their own to bring about changes in behavior. Additional measures, such as educating consumers and promoting healthy eating habits, may be necessary. The research conducted by Vargas-Meza et al. (2019) corroborates our results on the efficacy of color-coded FoPLs. Consumers demonstrated greater acceptance and comprehension of the Multiple Traffic Lights (MTL) and Warning Labels (WL) in comparison to more intricate labels. In our research, we also discovered that NutriScore, a system that employs a color-coded scheme, was more successful in attracting consumer attention and impacting product selection, especially in categories such as cereals and protein bars. Egnell et al. (2018) conducted a comparative research in 12 countries, which showed that NutriScore was the most effective in aiding customers in comprehending the nutritional value of items. Our research supports the idea that NutriScore not only attracted more attention but also helped consumers make better educated and healthier choices. This is evident from the dramatic improvements we found in consumer preferences. Under addition, van Herpen and van Trijp (2011) investigated the influence of various FoPLs on customer decision-making under diverse circumstances, including situations with limited time. The study revealed that labels and logos resembling traffic lights were very successful. This aligns with our research, which showed that NutriScore, a label inspired by traffic lights, successfully captured customer attention and affected their product selection, even when they were pressed for time. This emphasizes the resilience of NutriScore in practical buying situations when rapid decision-making is often necessary. Becker et al. (2015) presented empirical data indicating that FoPLs are more likely to be seen and given attention by customers compared to conventional nutrition information panels. Our research demonstrated that NutriScore attracted more fixations and gained faster initial attention than alternative labeling systems, as shown by the eye tracker data. This implies that the strategic positioning and configuration of FoPLs play a vital role in ensuring that customers perceive and make use of these labels efficiently. In addition, the integration of online biometric techniques, such as eye-tracking via webcams, as shown by Yang and Krajbich (2021), presents significant opportunities to expand this study outside conventional laboratory environments. Their research demonstrated that online eyetracking can accurately reproduce results obtained in a laboratory setting, indicating that these technologies have the potential to be used for conducting consumer behavior studies in more realistic, real-world settings. This is consistent with our strategy of using sophisticated biometric technologies to evaluate customer reactions and emphasizes the possibility of wider usage in online settings, particularly as consumer engagements continue to shift toward digital platforms. In summary, our research adds to the existing body of literature that emphasizes the significance of FoPLs in encouraging individuals to make better food choices. Nevertheless, the rather limited changes in behavior seen indicate that although FoPLs are an essential instrument in public health efforts, they should be supplemented by other measures, such as educational campaigns and regulations that promote healthy eating situations. Subsequent studies should further investigate the enduring consequences of FoPLs, especially in diverse cultural settings, and evaluate the collective impact of FoPLs with other public health measures. Furthermore, more studies on the utilization of online biometric technologies are necessary, as shown by recent studies, to improve the authenticity and expandability of consumer behavior research.
Conclusions
To summarize, this study emphasizes the substantial financial advantages of using sophisticated online biometric techniques, such as FaceReader and eye tracking, in marketing research, specifically in comprehending customer behavior regarding FoPL. The incorporation of these technologies provides deep understanding into the unconscious reactions of customers, which conventional techniques may fail to consider. Through the analysis of customer engagement with various FoPL designs, organizations may optimize their marketing efforts to impact purchase choices.
The results indicate that FoPLs, particularly those that include explicit nutritional details, have a substantial impact on consumer decision-making, directing people toward more nutritious alternatives. This transition not only enhances the well-being of the general population but also creates new prospects for firms that are prepared to pioneer advancements in product creation and marketing. Companies may enhance their product packaging by using biometric data to attract customer attention and promote favorable emotional responses, thus boosting the chances of product selection.
However, while it is hoped that operators will move toward healthier products with improved FoPL, research suggests that such labeling systems may also lead to unintended consequences. Potential drawbacks of the NutriScore method were examined in a study published in the journal Nutrients (Włodarek and Dobrowolski, 2022). One such drawback was that it did not take into consideration important vitamins, minerals, and bioactive substances. According to the authors, this restriction might force producers to rework their products mainly to raise their NutriScore scores, possibly at the price of vital nutrients and lowering the overall nutritional quality. Although FoPL is effective in guiding consumers toward healthier selections for processed meals with several ingredients, it does not apply to traditional or less processed items that have just one or a few ingredients. Because the approach focuses on macronutrient composition rather than overall dietary contribution, such products—which are frequently inherently nutrient-dense—may obtain a neutral or even less favorable grade. To avoid these unforeseen outcomes and to ensure that the NutriScore system does not unintentionally hinder the intake of traditionally healthful meals, the authors emphasized the need for improvement.
Furthermore, the findings of the research emphasize the significance of demographic variables, such as wealth and education, in influencing consumer reactions to FoPL. Comprehending these elements enables organizations to divide their market into smaller, more specific segments and tailor their strategies to diverse sets of consumers, thus optimizing the financial gains from their marketing efforts.
Essentially, the integration of online biometric techniques in consumer research signifies a cutting-edge development in marketing that merges technological advancement with strategic economic advantages. As companies become more aware of the importance of these insights, using these tactics is expected to become a common practice in the industry. This will lead to better-informed and effective marketing campaigns that strongly connect with customers’ subconscious preferences and behaviors.
Author Contributions
All authors contributed equally to this article.
Conflicts of Interest
The authors declare no potential conflicts of interest with respect to research, authorship and/or publication of this article.
Funding
This research was supported by grants VEGA 1/0624/22 “Neurogastronomy: Application of Implicit and Explicit Approaches in Modern Experience Gastronomy and their Influence on Consumer Behavior” and APVV-23-0244 “The Use of Consumer Neuroscience and Innovative Research Solutions in the Sensory Perception of Audio Stimuli and Its Application in Production, Commerce and Services.”
REFERENCES
Adamczyk, D., and Kuźmicz, A., 2021. Unmasking scents—Your nose knows more than you think. Available from: https://www.greenbook.org/mr/insights/unmaskingscents-your-nose-knows-more-than-you-think/ (Accessed: 2 September 2024).
Atli, D., 2020. Analyzing the strategic role of neuromarketing and consumer neuroscience. Hershey: IGI Global. 10.4018/978-1-7998-3126-6
Bargary, G., Bosten, J.M., Goodbourn, P.T., Lawrance-Owen, A.J., Hogg, R.E., and Mollon, J.D., 2017. Individual differences in human eye movements: An oculomotor signature? Vision Research. 141: 157–169. 10.1016/j.visres.2017.03.001
Becker, M.W., Bello, N.M., Sundar, R.P., Peltier, C., and Bix, L., 2015. Front of pack labels enhance attention to nutrition information in novel and commercial brands. Food Policy. 56: 76–86. 10.1016/j.foodpol.2015.08.001
Berčík, J., Mravcová, A., Gálová, J., and Mikláš, M., 2020. The use of consumer neuroscience in aroma marketing of a service company. Potravinarstvo Slovak Journal of Food Sciences. 14: 1200–1210. 10.5219/1465
Berčík, J., Mravcová, A., Sendra, E., López Lluch, D.B., and Farkaš, A., 2024. FaceReader as a neuromarketing tool to compare the olfactory preferences of customers in selected markets. Spanish Journal of Marketing–ESIC. 29(7): 46–64. 10.1108/SJME-03-2023-0050
Bialkova, S., Grunert, K.G., Juhl, H.J., Wasowicz-Kirylo, G., Stysko-Kunkowska, M., and van Trijp, H.C.M., 2014. Attention mediates the effect of nutrition label information on consumers’ choice: Evidence from a choice experiment involving eye-tracking. Appetite. 76: 66–75. 10.1016/j.appet.2013.11.021
Bix, L., Sundar, R.P., Bello, N.M., Peltier, C., Weatherspoon, L.J., and Becker, M.W., 2015. To see or not to see: Do front of pack nutrition labels affect attention to overall nutrition information? PLoS One. 10(10): e0139732. 10.1371/journal.pone.0139732
Bradley, M.M., and Lang, P.J., 1994. Measuring emotion: The self-assessment manikin and the semantic differential. Journal of Behavior Therapy and Experimental Psychiatry. 25(1): 49–59. 10.1016/0005-7916(94)90063-9
Braesco, V., and Drewnowski, A., 2023. Are front-of-pack nutrition labels influencing food choices and purchases, diet quality, and modeled health outcomes? A narrative review of four systems. Nutrients. 15(1): 205. 10.3390/nu15010205
Brockinton, A., Hirst, S., Wang, R., McAlaney, J., and Thompson, T., 2022. Utilising online eye-tracking to discern the impacts of cultural backgrounds on fake and real news decision-making. Frontiers in Psychology. 13: 999780. 10.3389/fpsyg.2022.999780
Castellini, G., Bertorelli, S., Carruba, M., Donini, L.M., Martini, D., and Graffigna, G., 2024. The role of Nutri-Score and NutrInform battery in guiding the food choices of consumers with specific nutritional needs: A controlled study. Nutrition, Metabolism, and Cardiovascular Diseases. 34(12): 2789–2798. 10.1016/j.numecd.2024.08.007
Cecchini, M., and Warin, L., 2016. Impact of food labelling systems on food choices and eating behaviours: A systematic review and meta-analysis of randomized studies. Obesity Reviews. 17(3): 201–210. 10.1111/obr.12364
Cong, L., Luan, S., Young, E., Mirosa, M., Bremer, P., and Torrico, D.D., 2023. The application of biometric approaches in agri-food marketing: A systematic literature review. Foods. 12(16): 2982. 10.3390/foods12162982
Davidson, R.J., 1992. Anterior cerebral asymmetry and the nature of emotion. Brain and Cognition. 20(1): 125–151. 10.1016/0278-2626(92)90065-T
De Bauw, M., Matthys, C., Poppe, V., Franssens, S., and Vranken, L., 2021. A combined Nutri-Score and “Eco-Score” approach for more nutritious and more environmentally friendly food choices? Evidence from a consumer experiment in Belgium. Food Quality and Preference. 93(1): 104276. 10.1016/j.foodqual.2021.104276
Devaux, M., Aldea, A., Lerouge, A., Vuik, S., and Cecchini, M., 2024. Establishing an EU-wide front-of-pack nutrition label: Review of options and model-based evaluation. Obesity Reviews. 25(6): e13719. 10.1111/obr.13719
Dubois, P., Albuquerque, P., Allais, O., Bonnet, C., Bertail, P., Combris, P., et al., 2021. Effects of front-of-pack labels on the nutritional quality of supermarket food purchases: evidence from a large-scale randomized controlled trial. Journal of the Academy of Marketing Science. 49(1): 119–138. 10.1007/s11747-020-00723-5
Egnell, M., Talati, Z., Hercberg, S., Pettigrew, S., and Julia, C., 2018., Objective understanding of front-of-package nutrition labels: An international comparative experimental study across 12 countries. Nutrients. 10(10):1542. 10.3390/nu10101542
Egnell, M., Talati, Z., Galan, P., Andreeva, V.A., Vandevijvere, S., Gombaud, G., et al., 2020. Objective understanding of the Nutri-score front-of-pack label by European consumers and its effect on food choices: An online experimental study. International Journal of Behavioral Nutrition and Physical Activity. 17(1): 146. 10.1186/s12966-020-01053-z
Fialon, M., Serafini, M., Galan, P., Kesse-Guyot, E., Touvier, M., Deschasaux-Tanguy, M., et al., 2022. Nutri-score and NutrInform battery: Effects on performance and preference in Italian consumers. Nutrients. 14(17): 3511. 10.3390/nu14173511
Fialon, M., Babio, N., Salas-Salvadó, J., Galan, P., Kesse-Guyot, E., Touvier, M., et al., 2023. Comparative understanding and preference of Nutri-Score and NutrInform battery in a sample of Spanish consumers. European Journal of Public Health. 33(2): 293–298. 10.1093/eurpub/ckad002
Gabor, A.M., Stojnić, B., and Ban Ostić, D., 2020. Effects of different nutrition labels on visual attention and accuracy of nutritional quality perception—Results of an experimental eye-tracking study. Food Quality and Preference. 84: 103948. 10.1016/j.foodqual.2020.103948
Gažárová, M., and Lenártová, P., 2024. Efektivita využitia Nutri-Score ako nástroja Front-of-Pack Labelling (FOPL) pri výbere zdravších variantov potravín (Effectiveness of using Nutri-Score as a Front-of-Pack Labelling (FOPL) tool in selecting healthier food options). Nitra: Slovak University of Agriculture.
Ghosh, R.K., Sanghvi, R., and Sahay, A., 2023. Consumer preference for nutrition front-of-pack-label formats in India: Evidence from a large-scale experimental survey. Food Quality and Preference. 111: 104993. 10.1016/j.foodqual.2023.104993
Goettker, A., and Gegenfurtner, K.R., 2021. A change in perspective: The interaction of saccadic and pursuit eye movements in oculomotor control and perception. Vision Research. 188: 283–296. 10.1016/j.visres.2021.08.004
Graham, D.J., Lucas-Thompson, R.G., and Slejko, G., 2023. The role of front-of-package nutrition labels with and without explanatory videos on parent and child food choices. Nutrients. 15(18): 4082. 10.3390/nu15184082
He, J., Mazzù, M.F., and Baccelloni, A., 2023. A 20-country comparative assessment of the effectiveness of Nutri-Score vs. NutrInform battery front-of-pack nutritional labels on consumer subjective understanding and liking. Nutrients. 15(13): 2852. 10.3390/nu15132852
Hessels, R.S., Kemner, C., van den Boomen, C., and Hooge, I.T.C., 2016. The area-of-interest problem in eyetracking research: A noise-robust solution for face and sparse stimuli. Behavior Research Methods. 48(4): 1694–1712. 10.3758/s13428-015-0676-y
Höfling, T.T.A., and Alpers, G.W., 2023. Automatic facial coding predicts self-report of emotion, advertisement and brand effects elicited by video commercials. Frontiers in Neuroscience. 17: 1125983. 10.3389/fnins.2023.1125983
Holmqvist, K., 2011. Eye tracking: A comprehensive guide to methods and measures. Oxford: Oxford University Press.
Horská, E., Mušinská, K., Nagyová, L., Košovská, I., and Fuga, V., 2021. Healthy and innovative food versus Slovak consumer. Proceedings from The 2021 International Scientific Conference Economic Sciences for Agribusiness and Rural Economy, Warsaw. 5: 50–55. 10.22630/ESARE.2021.5.6
Ikonen, I., Sotgiu, F., Aydinli, A., and Verlegh, P.W.J., 2020. Consumer effects of front-of-package nutrition labeling: An interdisciplinary meta-analysis. Journal of the Academy of Marketing Science. 48: 360–383. 10.1007/s11747-019-00663-9
Laffan, K., Sunstein, C., and Dolan, P., 2024. Facing it: Assessing the immediate emotional impacts of calorie labelling using automatic facial coding. Behavioural Public Policy. 8(3): 572–589. 10.1017/bpp.2021.32
Landmann, E., 2023. I can see how you feel—Methodological considerations and handling of Noldus’s FaceReader software for emotion measurement. Technological Forecasting and Social Change. 197: 122889. 10.1016/j.techfore.2023.122889
Lang, P.J., and Davis, M., 2006. Emotion, motivation, and the brain: Reflex foundations in animal and human research. Progress in Brain Research. 156: 3–29. 10.1016/S0079-6123(06)56001-7
Lobstein, T., and Davies, S., 2009. Defining and labelling “healthy” and “unhealthy” food. Public Health and Nutrition. 12(3): 331–340.
Loijens L., and Krips, O., 2013. Facereader methodology. Noldus Information Technology, Wageningen.
Ma, G., and Zhuang, X., 2021. Nutrition label processing in the past 10 years: Contributions from eye tracking approach. Appetite. 156: 104859. 10.1016/j.appet.2020.104859
Mahanama, B., Jayawardana, Y., Rengarajan, S., Jayawardena, G., Chukoskie, L., Snider, J., et al., 2022. Eye movement and pupil measures: A review. Frontiers in Computer Science. 3: 1–22. 10.3389/fcomp.2021.733531
Maison, D., and Pawłowska, B., 2017. Using the Facereader method to detect emotional reaction to controversial advertising referring to sexuality and homosexuality. Neuroeconomic and Behavioral Aspects of Decision Making Springer Proceedings in Business and Economics. Springer International Publishing. pp. 309–327. 10.1007/978-3-319-62938-4_20
Martini, D., Marangoni, F., Banterle, A., Donini, L.M., Riccardi, G., Poli, A., et al., 2022. Relationship between front-of-pack labeling and nutritional characteristics of food products: An attempt of an analytical approach. Frontiers in Nutrition. 9: 963592. 10.3389/fnut.2022.963592
Mazzù, M.F., Romani, S., Baccelloni, A., and Gambicorti, A., 2021. A cross-country experimental study on consumers’ subjective understanding and liking on front-of-pack nutrition labels. International Journal of Food Sciences and Nutrition. 72(6): 833–847. 10.1080/09637486.2021.1873918
Motoki, K., Park, J., Pathak, A., and Spence, C., 2021. Constructing healthy food names: On the sound symbolism of healthy food. Food Quality and Preference. 90: 104157. 10.1016/j.foodqual.2020.104157
Noldus. 2021. FaceReader: Tool for automatic analysis of facial expressions: Version 9. Available from: https://www.noldus.com
Pettigrew, S., Jongenelis, M.I., Jones, A., Hercberg, S., and Julia, C., 2023. An 18-country analysis of the effectiveness of five front-of-pack nutrition labels. Food Quality and Preference. 104: 104691. 10.1016/j.foodqual.2022.104691
Plasek, B., Lakner, Z., and Temesi, Á., 2020. Factors that influence the perceived healthiness of food—Review. Nutrients. 12(6): 1881. 10.3390/nu12061881
Rønnow, H.N., 2020. The effect of front-of-pack nutritional labels and back-of-pack tables on dietary quality. Nutrients. 12(6): 1704. 10.3390/nu12061704
Rutter, S., Bonne, M., Stones, C., and Macduff, C., 2022. Using FaceReader to explore the potential for harnessing emotional reactions to motivate hand hygiene. The Journal of Infection Prevention. 23(3): 87–92. 10.1177/17571774211060394
Savov, R., Tkáč, F., Cheben, J., Kozáková, J., and Berčík, J., 2022. Impact of different FoPL systems (Nutri-Score vs NutrInfrom) on consumer behaviour: Case study of the Slovak Republic. Amfiteatru Economic Journal. 24(61): 797–816. 10.24818/EA/2022/61/797
Shangguan, S., Afshin, A., Shulkin, M., Ma, W., Marsden, D., Smith, J., et al., 2019. A meta-analysis of food labeling effects on consumer diet behaviors and industry practices on behalf of the Food PRICE (Policy Review and Intervention Cost-Effectiveness) Project HHS public access. American Journal of Preventive Medicine. 56(2): 300–314. 10.1016/j.amepre.2018.09.024
Skiendziel, T., Rösch, A.G., and Schultheiss, O.C., 2019. Assessing the convergent validity between the automated emotion recognition software Noldus FaceReader 7 and Facial Action Coding System Scoring. PLoS One. 14(10): e0223905. 10.1371/journal.pone.0223905
Tarabella, A., and Voinea, L., 2013. Advantages and limitations of the front-of-package (FOP) labeling systems in guiding the consumers’ healthy food choice. Amfiteatru Economic. 15(33): 198–209. 10.1016/j.appet.2019.104485
Temple, N.J., 2020. Front-of-package food labels: A narrative review. Appetite. 144: 104485.
Van der Cruyssen, I., Ben-Shakhar, G., Pertzov, Y., Guy, N., Cabooter, Q., Gunschera, L.J., et al., 2023. The validation of online webcam-based eye-tracking: The replication of the cascade effect, the novelty preference, and the visual world paradigm. Behavior Research Methods. 56(5): 4836–4849. 10.3758/s13428-023-02221-2
van Herpen, E., and van Trijp, H.C.M., 2011. Front-of-pack nutrition labels. Their effect on attention and choices when consumers have varying goals and time constraints. Appetite. 57(1): 148–160. 10.1016/j.appet.2011.04.011
Vargas-Meza, J., Jáuregui, A., Contreras-Manzano, A., Nieto, C., and Barquera, S., 2019. Acceptability and understanding of front-of-pack nutritional labels: An experimental study in Mexican consumers. BMC Public Health. 19(1): 1751. 10.1186/s12889-019-8108-z
WebGazer. Available from: webgazer.io. (Accessed: 2 September 2024).
Włodarek, D., and Dobrowolski, H., 2022. Fantastic foods and where to find them—Advantages and disadvantages of Nutri-Score in the search for healthier food. Nutrients. 14(22): 4843. 10.3390/nu14224843
Yang, X., and Krajbich, I., 2021. Webcam-based online eye-tracking for behavioral research. Judgment and Decision Making. 16(6): 1485–1505. 10.1017/S1930297500008512
Yu, C.Y., and Ko, C.H., 2017. Applying FaceReader to recognize consumer emotions in graphic styles. Procedia CIRP. 60: 104–109. 10.1016/j.procir.2017.01.014
Zhu, A., Boonipat, T., Cherukuri, S., and Bite, U., 2024. Defining standard values for FaceReader facial expression software output. Aesthetic Plastic Surgery. 48(5): 785–792. 10.1007/s00266-023-03468-y
Appendix A
| Total fixation duration | |||||
| Without labels | With Nutrinform product | With Nutrinform labels | With NutriScore product | With NutriScore labels | |
| Cereals | 50.84 | 41.41 | 7.30 | 42.79 | 10.05 |
| Yogurts | 50.25 | 41.06 | 10.98 | 44.61 | 6.38 |
| Bars | 51.15 | 39.12 | 11.96 | 44.35 | 6.87 |
| Time to first fixation | |||||
| Without labels | With Nutrinform product | With Nutrinform labels | With NutriScore product | With NutriScore labels | |
| Cereals | 0.00 | 0.00 | 6.01 | 0.00 | 2.95 |
| Yogurts | 0.00 | 0.00 | 5.28 | 0.00 | 2.73 |
| Bars | 0.00 | 0.00 | 2.93 | 0.00 | 5.75 |
| First fixation duration | |||||
| Without labels | With Nutrinform product | With Nutrinform labels | With NutriScore product | With NutriScore labels | |
| Cereals | 0.41 | 0.21 | 0.20 | 0.34 | 0.57 |
| Yogurts | 0.34 | 0.43 | 0.22 | 0.32 | 0.36 |
| Bars | 0.35 | 0.41 | 0.36 | 0.23 | 0.29 |
| Fixation count | |||||
| Without labels | With Nutrinform product | With Nutrinform labels | With NutriScore product | With NutriScore labels | |
| Cereals | 7685.00 | 6254.00 | 1219.00 | 6519.00 | 1459.00 |
| Yogurts | 7632.00 | 6201.00 | 1484.00 | 6943.00 | 848.00 |
| Bars | 7738.00 | 5989.00 | 1749.00 | 6731.00 | 1160.00 |