
Download
Pectin yield % = m 0 m × 100 1 DE = A 1745 A 1745 + A 1630 × 100 2
Y = β 0 + Σ β i X i + Σ β i i X i 2 + Σ β i j X i X j 3
PAPER
Low cost green pectin extraction from lemon peels using ultrasound technique: Artificial intelligence – genetic algorithm modeling and characterization
Rofia Djerri1, Louiza Himed1, Esma Anissa Trad khodja2, Salah Merniz3, Malika Barkat1, Chawki Bensouici4, Mohammed Berkani5*, Nashi K. Alqahtani6, Woroud A. Alsanei7, Rokayya Sami8*, Awatif M. Almehmadi9, Mahmoud Helal10
1The Biotechnology and Food Quality Research Laboratory (BIOQUAL), INATAA, University of the Brothers Mentouri – Constantine 1, Algeria;
2Higher National School of Biotechnology Taoufi Khaznadar (ENSB). University town, BP E66, Ali Mendjeli, 25100, Algeria;
3Institute of Hygiene and Industrial Safety, University Batna 2, Algeria;
4Laboratory of Biochemistry, Biotechnology and Health Division, Center for Research in Biotechnology, Constantine, Algeria;
5Biotechnology Laboratory, Higher National School of Biotechnology Taoufi Khaznadar (ENSB). University town, BP E66, Ali Mendjeli, 25100, Algeria;
6Department of Food and Nutrition Sciences, College of Agricultural and Food Sciences, King Faisal University, Al-Ahsa, Saudi Arabia;
7Department of Food and Nutrition, Faculty of Human Sciences and Design, King Abdulaziz University, Jeddah, Saudi Arabia;
8Department of Food Science and Nutrition, College of Sciences, Taif University, Taif, Saudi Arabia;
9Department of Clinical Nutrition, Faculty of Applied Medical Sciences, Umm Al-Qura University, Makkah, Saudi Arabia;
10Department of Mechanical Engineering, Faculty of Engineering, Taif University, Taif, Saudi Arabia
Abstract
The hybrid optimization approach integrating response surface methodology box-behnken design (RSM-BBD) and artificial neural network-genetic algorithm (ANN-GA) was employed to enhance extraction of pectin from lemon peel via ultrasound-assisted extraction techniques. By using these techniques, extraction conditions were improved, and a model was constructed. The extraction time (30–60min), amplitude (25–50%), and pH (1.2–4.2) were considered as input variables, while the output variable was pectin yield (PY%). The results showed that the prediction efficiency of RSM was higher than ANN-GA. With an ANN as the fitness function, the genetic algorithm determined a maximum pectin yield of 38.67% at a pH of 1.2, 30 min extraction time, and 50% amplitude. The experimental pectin extraction yield was found to be 38.92%. At an extraction time of 60 min, with an amplitude of 25% and a pH 4.2, the RSM-predicted value was 39.77%, closely aligning with the actual experimental value of 40.23%. FTIR and SEM were employed for further characterization of the extracted pectin. These analyses demonstrated that RSM has proven to be an effective technique for enhancing the extraction of pectin from lemon peel.
Key words: Lemon peel, pectin extraction, response surface methodology (RSM), box-behnken design (BBD), artificial neural network (ANN), ultrasound
*Corresponding Authors: Mohammed Berkani, Biotechnology Laboratory, Higher National School of Biotechnology Taoufi Khaznadar (ENSB). University town, BP E66, Ali Mendjeli, 25100, Algeria. Email: [email protected]; Rokayya Sami, Department of Food Science and Nutrition, College of Sciences, Taif University, P.O. Box 11099, Taif 21944, Saudi Arabia. Email: [email protected]
Academic Editor: Prof. Marco Dalla Rosa – University of Bologna, Italy
Received: 16 August 2024; Accepted: 23 March 2025; Published: 1 July 2025
© 2025 Codon Publications
This is an Open Access article distributed under the terms of the Creative Commons Attribution-NonCommercial-ShareAlike 4.0 International (CC BY-NC-SA 4.0). License (http://creativecommons.org/licenses/by-nc-sa/4.0/)
Introduction
Citrus fruits are globally significant and highly valued cropsbecause of their economic and nutritional value (Kalal et al., 2023). These fruits often result in a considerable amount of waste and byproducts, depending on their geographic location, consumption habits, and cultivation methods(Fierascu et al., 2020). They are among the most widely cultivated crops globally, with approximately 50% of the original mass of the whole fruit consisting of juice and peel. Each year, around 90,000 tons of fresh citrus fruits are processed, resulting in about 45,000 tons of juice and peel waste (Salma et al., 2012). One of the major challenges to be addressed for global advancement by 2030 is the sustainable management of resources throughout all phases of industrialization, production, and consumption. Effectively addressing this challenge is crucial for enhancing resource sustainability and efficiency; consequently, a primary goal is to reduce global food waste by 50% throughout both the production and consumption stages (Ardra and Barua, 2022). This decrease not only saves resources but also helps to build more resilient and efficient systems that can support sustainable development goals such as improving pectin extraction methods and diversifying product manufacturing (Luque and Clark, 2013).
Pectin is an anionic polysaccharide found in almost all plant tissues. It is a significant byproduct of the fruit and vegetable industry. Previously, an array of bioactive substances was incorporated into original pectin films to augment their antioxidant and antimicrobial characteristics. This approach was employed to reduce the likelihood of pathogen proliferation on food surfaces (Eça et al., 2015). In addition, pectin serves as a functional component within the food sector, often employed for its properties, such as its gelling capabilities. It serves as a thickening and stabilizing agent (Lasunon and Sengkhamparn, 2022). Pectin, a complex polysaccharide, varies in composition depending on botanical type, ripening stage, plant tissue, and extraction method (Lara-Espinoza et al., 2018). It is commonly extracted using hot water (60–100°C), and mineral acids are derived from vegetable wastes such as apple pomace, citrus peels, sunflower heads, sugar beet pulp, etc. Alternatively, traditional acid extraction involves using organic acids, particularly citric acid, at a pH range of 1.5–3 for a duration of 5–6 hours (Saberian et al., 2018). Citric acid, rather than inorganic acids, has recently been used as an extractant to extract pectin (Van Hung et al., 2021).
Ultrasound is an innovative technology utilizing radio waves with frequencies exceeding 10 MHz. It was first intended to preserve food, but in the last decade, it has also been used to extract bioactive compounds (Anticona et al., 2020). Ultrasonic cavitation bubbles allow the remover to enter deeper into the plant cell wall and release plant intracellular products. In addition, by focusing on localized sample zones, ultrasonic probes provide more effective extraction. Ethanol concentration, extraction time, and amplitude are the most extensively examined parameters in ultrasound-assisted extraction (UAE) (Suhaimi et al., 2019), However, using statistical modeling tools is an effective and widely used technique for investigating the independent and collective interactions among the process variables.
The use of ultrasonic irradiation has made UAE more common than other extraction techniques because it can improve repeatability, decrease extraction times, use less solvent, use less energy, and operate at a lower temperature (Suhaimi et al., 2019).
The basis of UAE is cavitation, a process that releases the target chemicals from their natural matrices by rupturing cell walls. This cavitation process improves the contact interface and results in a greater dispersion of the solid phase in the liquid. This explains why UAE is frequently chosen over more conventional techniques since it enables the production of larger yields in less time with less solvent. This makes it a more environmentally friendly method with lower running costs (Yerena-Prieto et al., 2022).
Response surface methodology (RSM) serves as a statistical and mathematical tool widely applicable in numerous engineering contexts. It facilitates the streamlining and optimization of procedures and explores the correlations that relate the predicted response and selected factors (Simić et al., 2016). Artificial neural network (ANN) which incorporates multiple input layers, hidden layers, and an output layer, the configuration of which depends on the selected variables, is an excellent technology for nonlinear multivariate modeling. Because of its ability to provide universal approximation, ANN has proven to be useful in optimizing a wide range of application fields (Muthusamy et al., 2019). Further example is genetic algorithm (GA), which is an optimization method based on biological evolution theory. Because ANN and RSM modeling offer different benefits in terms of the ability of a process’s to forecast outcomes and optimize its operations, researchers compare the results of the two methodologies to gain a better understanding of the processes under investigation (Pradhan et al., 2020).
The purpose of this study is the evaluation of the UAE as a technique for extracting pectin from lemon peel, to determine the impact and cumulative impacts of the three primary extraction factors (pH, extraction time, and amplitude), and to optimize operational parameters using hybrid approach based on RSM-ANN to achieve the highest pectin yield. FTIR and morphological analyses were additionally employed for the characterization of the pectin extracted under optimal conditions.
Material and Methods
Sampling
The lemon peels were collected from coffee shops and restaurants and oven-dried overnight at 60°C (He et al., 2021), crushed to a fine powder using a grander, and sieved using a sieve shaker under 250 μm of porosity.After ward, the powder was subsequently stored at room temperature for later use (Kanmani et al., 2014).
UAE for the extraction of pectin from lemon peel
An ultrasonic device operating (Sonics & Materials Inc, CT, Newtown, USA) with a 13 mm diameter probe was operated at a frequency of 20 kHz and 70 W of power to remove pectin from the powder of peel lemons prepared. The sample and distilled water used in the extraction combination were both pH-acidified with citric acid (pH 1,2) and NaOH to increase pH (1.2, 2.7, and 4.2). For 30, 45, and 60 min, different amplitudes of sonication (25, 38, and 50%, respectively) were applied. After the ultrasonic treatment, the solution was refined and mixed in equal proportions with chilled ethyl alcohol (>96%, v/v) before being allowed to float for 2 h. The pectin that floated was isolated using centrifugation (4000rpm, 40min), rinsed thrice with 96% ethyl alcohol, subjected to additional cleaning with acetone, dried at 50°C in a hot air oven until they attained a stable weight. The yield of extraction was calculated using the following Equation 1:
where m is the sample weight (g), and m0 is the weight of dried pectin (in grams) (Dranca and Oroian, 2019).
FTIR and morphological analyses
FTIR/ATR
On a brand-name FTIR-ATR spectrometer (Alpha-Brucker), the pectin was analyzed in the 400–4000 cm–1 range of mid-infrared wave numbers. This equipment is controlled using Opus 6.5 software and features a robust attenuated total reflectance (ATR) accessory with diamond crystals, designed to streamline analysis without the requirement of a KBr pellet, ensuring convenience and efficiency. The total number of carboxyl groups as represented by the sum of the bands at 1745 and 1630 cm−1. The percentage of DE was calculated according to Equation 2 (Liew et al., 2016).
Here, A1630 and A1745 represent the absorbance intensity at 1630 and 1745cm−1, respectively, indicating nonmethyl-esterified carboxyl groups and methyl-esterified carboxyl groups.
Morphological analysis
Scanning electron microscopy (SEM) was performed using a Quanta 250 from the company “FEI”. The FEI Quanta 250, with an acceleration voltage of 10–15 kilovolt and low vacuum imaging mode. The prepared pectin powder, witha moisture content of 8.98 ± 0.86%,was applied on an aluminum support that had previously been covered in a sticker made of carbon (graphite). The sample is then placed in the microscope chamber for analysis.
Experimental design
BBD-RSM
A mathematical and statistical approach known as RSM was employed, utilizing the box-behnken design (BBD) within the Minitab 19.0 software. This method optimized responses and established mathematical correlations among the independent variables. It was specifically designed to create experimental models and evaluate the relative importance of each chosen variable. Moreover, RSM was instrumental in defining the optimal conditions necessary to achieve the desired outcomes (Smaali et al., 2022).
To anticipate the performance of the variables, a polynomial regression model was created from the BBD. The following parameter ranges were fixed: extraction time (30–60min), ultrasonic amplitude (25–50%), and pH (1.2–4.2) To attain maximum pectin production (Table 1), the enhancement of pectin extraction conditions involved the execution of the 15 experiments generated from the BBD (Table 2).
Table 1. Actual values of independent variables.
| Factor | Coded variable | Unit | Level | |
|---|---|---|---|---|
| –1 | 1 | |||
| X1 | pH | – | 1.2 | 4.2 |
| X2 | Time | min | 30 | 60 |
| X3 | Amplitude | % | 25 | 50 |
Table 2. Box-behnken design matrix and experimental yields.
| Run | Coded variable | Real variable | Observed response Y % | ||||
|---|---|---|---|---|---|---|---|
| A | B | C | pH | Time min | Amp % | ||
| 1 | 1 | −1 | 0 | 4.2 | 30 | 38 | 10.5 |
| 2 | 1 | 0 | 1 | 4.2 | 45 | 50 | 17.8 |
| 3 | −1 | 1 | 0 | 1.2 | 60 | 38 | 34.5 |
| 4 | 0 | −1 | 1 | 2.7 | 30 | 50 | 21.9 |
| 5 | 1 | 0 | −1 | 4.2 | 45 | 25 | 25.5 |
| 6 | 0 | 1 | −1 | 2.7 | 60 | 25 | 36.5 |
| 7 | 1 | 1 | 0 | 4.2 | 60 | 38 | 20 |
| 8 | −1 | 0 | −1 | 1.2 | 45 | 25 | 11.4 |
| 9 | 0 | 0 | 0 | 2.7 | 45 | 38 | 19.6 |
| 10 | 0 | 1 | 1 | 2.7 | 60 | 50 | 19.6 |
| 11 | −1 | −1 | 0 | 1.2 | 30 | 38 | 22.6 |
| 12 | −1 | 0 | 1 | 1.2 | 45 | 50 | 7.2 |
| 13 | 0 | 0 | 0 | 2.7 | 45 | 38 | 6.6 |
| 14 | 0 | 0 | 0 | 2.7 | 45 | 38 | 13.6 |
| 15 | 0 | −1 | −1 | 2.7 | 30 | 25 | 11.9 |
X1, pH; X2, Time; X3, Amplitude (%) and represents the pectin yield (%).
The analysis of variance (ANOVA) was conducted to validate the theoretical assumptions made during the optimization process. The generation of 3D response surface plots aimed to depict the correlations between each independent variable and the dependent variable. Identification of the optimal conditions was accomplished through the utilization of a second-order polynomial equation (Muthusamy et al., 2019).
A second-order polynomial model was fitted to the response variable and factors (Equation 3).
The evaluation of the model’s efficacy involved the scrutiny of regression coefficients, ANOVA outcomes, as well as F- and P-values. In this context, Y represents the pectin yield (%), X signifies the factors, and βi denotes the coefficients (Mamiru and Gonfa, 2023).
The anticipated response values were calculated based on the regression equation. To evaluate the model’s statistical reliability, a variance analysis was carried out. The significance of the factors and the regression model was determined through F- and P-values. The reliability of the regression model was affirmed by a robust Student’s t-test, as evidenced by a low P-value (Berkani et al., 2020; Vasseghian et al., 2020).
ANN-GA Modeling
An ANN is a computational model designed to automatically discover the most suitable linear or nonlinear relationship (Bouizzar et al., 2023; Kadmi et al., 2023). In this study, the appropriate model, which accurately describes the system, was developed using ANN, and GA was utilized as an optimizer to work with the model. MATLAB 14a and its associated toolboxes were utilizedto optimize the modeling process, resulting in the creation of an additional dataset that included 205 forecasted outcomes. These data were derived from the box-behnken polynomial regression detailed in our prior study (Vasseghian et al., 2020). The ANN model was developedand enhanced utilizing the feed-forward back propagation (BP) or Levenberg-Marquard (trainlm) technique. This approach also facilitated the determination of the optimal number of neurons for the hidden layer.
ANN creates a network that may represent intricate operational relationships by connecting mathematical nodes, or neurons. In the 1940s, neural networks were developed to help cognitive scientists comprehend the fundamental behavior of the neurological system. The first clue for the creation of ANNs’ numerical structures came from the way the human brain learns. As a result, they were created and used as substitute mathematical tools to address many issues that arise in the fields of process control, pattern recognition, system identification, prediction, and classification, among others (Bahmani et al., 2018).
Results
Analysis of the models
The experiments were conducted with diverse parameter combinations, leading to varying yields under different experimental conditions. The obtained data were subsequently analyzed by fitting them to a quadratic model, with R2 value of 83.89% and an adjusted R2 value of 54.89% for both linear and interactive models.
As indicated by ANOVA results presented in Table 3, the following second-order equation was obtained using the following equation (Equation 4):
Pectin yield (%) = 15.47 − 1.45 X1 + 6.09 X2 − 3.16 X3 − 1.12 X1X1 + 7.50 X2X2 − 0.50 X3X3 − 0.65 X1X2 − 4.55 X1X3 − 6.72 X2X3(4)
Table 3. ANOVA results of polynomial quadratic model of pectin yield.
| Spring | DF | Adj SS | Adj MS | F-value | P-value |
|---|---|---|---|---|---|
| Model | 9 | 880.71 | 97.857 | 2.89 | 0.127 |
| Linear | 3 | 393.29 | 131.097 | 3.87 | 0.089 |
| X1 | 1 | 16.82 | 16.820 | 0.50 | 0.512 |
| X2 | 1 | 296.46 | 296.461 | 8.76 | 0.032 |
| X3 | 1 | 80.01 | 80.011 | 2.36 | 0.185 |
| Square | 3 | 222.02 | 74.005 | 2.19 | 0.208 |
| X1X1 | 1 | 4.64 | 4.639 | 0.14 | 0.726 |
| X2X2 | 1 | 207.92 | 207.923 | 6.15 | 0.056 |
| X3X3 | 1 | 0.91 | 0.908 | 0.03 | 0.876 |
| 2-Way interaction | 3 | 265.40 | 88.468 | 2.61 | 0.163 |
| X1X2 | 1 | 1.69 | 1.690 | 0.05 | 0.832 |
| X1X3 | 1 | 82.81 | 82.810 | 2.45 | 0.178 |
| X2X3 | 1 | 180.90 | 180.902 | 5.35 | 0.069 |
| Error | 5 | 169.16 | 33.832 | - | - |
| Lack-of-fit | 3 | 143.45 | 47.817 | 3.72 | 0.219 |
| Pure error | 2 | 25.71 | 12.853 | - | - |
| Total | 14 | 1049.87 | - | - | - |
ANOVA presented in Table 3 provides a comprehensive overview of the results. It is crucial to emphasize that, among the various parameters considered, only the linear effect of X2 (time) significantly influences pectin extraction (p < 0.05). The parameters pH, extraction time (X2), and amplitude (X3) are denoted as X1, X2, and X3, respectively; the rationale for this can be attributed to the computed F-value. The value of F(2.89) is smaller than the corresponding F-value obtained from Fisher Table, where the tabulated value at (0.05, 9-5) is 4.77. ANOVA results indicate that the terms are not statistically significant except the linear term extraction time (X2). To test lack of fit, the test statistic F0 becomes crucial. If F0 is greater than or equal to F at the 0.05 significance level for the degrees of freedom (3-2), this indicates that the actual regression function does not adhere to a linear pattern. In this study, F0 was calculated as 3.72, which is significantly lower than the critical F-value of 19.16 at the 0.05 significance level for the degrees of freedom (3-2)). This finding indicates that the true regression function could be linear. Therefore, the adjusted R2 decreases when additional terms do not providea substantial improvement to the model sufficiently. In our case, all interaction terms are statistically insignificant, suggesting that it would be preferable to test a new model generated using an ANN.Consequently, employing ANN modeling with linear and nonlinear regression appears to be a more suitable approach for explaining the obtained data.
Impact criterion
Effect of pH (X1)
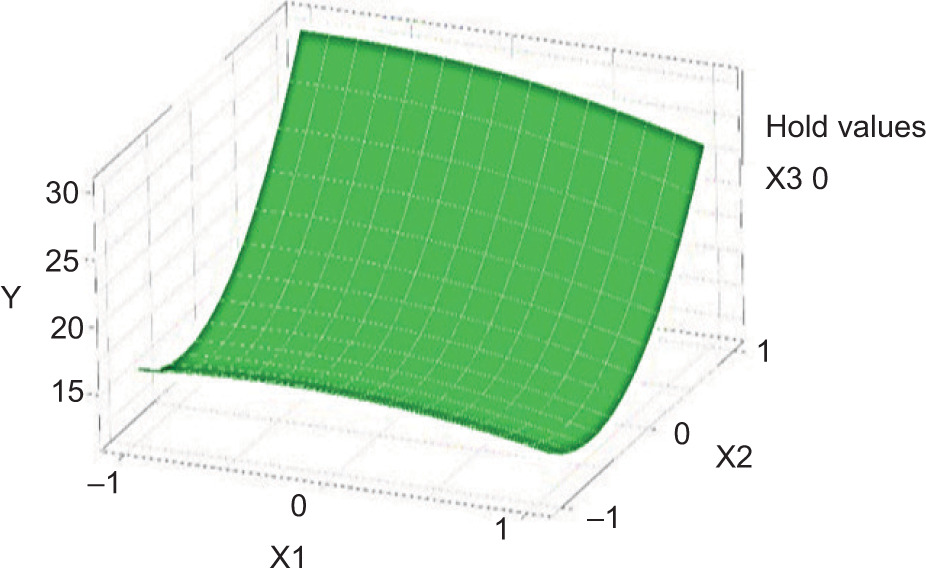
The pectin yield showed an increasing trend when pH increased between 1.2 and 4.2, accompanied by an increase in exposure time from 30 to 60 min, as illustrated in Figure 1. In particular, an increased acidity level at pH 3 has been documented to promote the hydrolysis of protopectin, resulting in the formation of soluble pectin, facilitating its extraction (Dao et al., 2021). Conversely, some studies indicate that pectin aggregation is more efficient above pH 3, leading to a delay in its release (Maran and Prakash, 2015). According to (Pandharipande et al., 2012), in relation to pectin derived from orange peel at a pH of 1, the extraction medium yields its maximum; however, at pH values of 4 and 5, very little yield is produced.
Figure 1. Three-dimensional plot of pectin yield as a function of pH and time at constant amplitude.
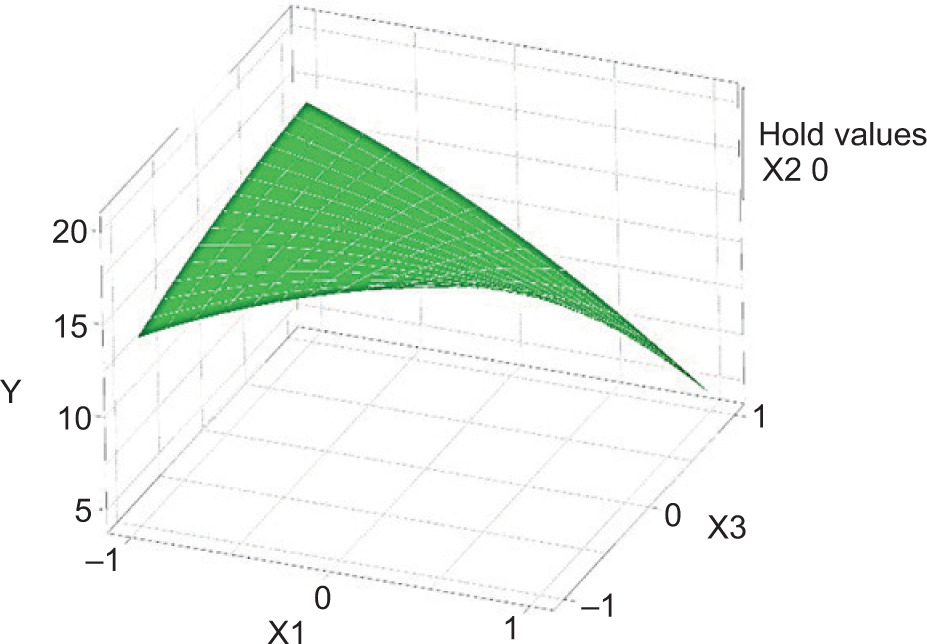
Effect of time (X2)
Figure 3 illustrates the variation of time and the yield of extracted pectin versus pH and frequency. After 60 min of mixture heads being exposed to ultrasonic waves, it was possible to achieve the maximum yield. The facilitation of mass transfer from plant tissues to the solution was notably enhanced by employing appropriate extraction duration. Pectin was released after the cell wall was damaged. Nevertheless, the extended extraction time led to the improvement of pectin yield by the pectin decomposition. Previous studies have identified the optimal extraction time for pectin from citrus peel to be between 60 and 70 min (Hamidon and Zaidel, 2017). The ideal extraction time for the maximum production of pectin was determined to be 60 min (Kulkarni et al., 2010); according to Belan and Israel ( ), after 1 h, the pectin output reached its maximum of 2.95%. At all extraction time levels, there is very little variation in the yield values, and they do not change substantially.As the extraction period was extended, a general decline in the production of pectin was noticed. The extraction process often takes between 20 and 60 min. Furthermore, in this range, a longer extraction period frequently yields a higher pectin yield.
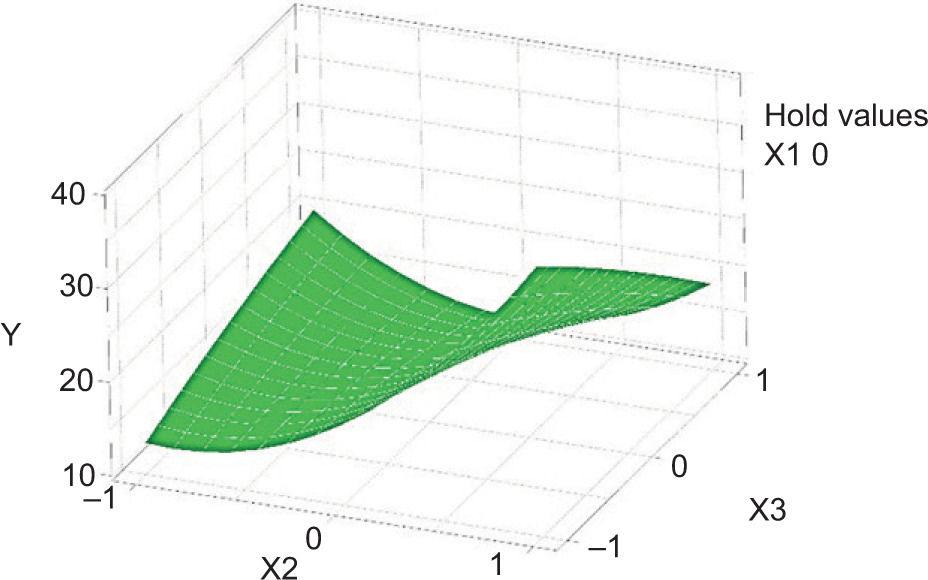
Effect of amplitude (X3)
Figures 2 and 3 show the effect of ultrasound amplitudes on the yield of pectin over time and pH. Pectin yield was observed to be the highest atan ultrasonic wave amplitudeof 25% and the lowest at 50%. The diminish might be clarified by the decreased cavitation movement at tall bubble volume concentrations. The immersion impact, which was shaped when numerous cavitation bubbles were created around the test tip, can decrease and screen the vitality transmission in the response medium. In the meantime, these bubbles would diminish the energy productivity through the inter-bubble impacts, such as advancing their collapse and misshapening in a non-spherical (Hu et al., 2020). In addition, the sample was stirred thoroughly with the solvent, citric acid, using the ultrasonic shock wave and high-velocity jet. This would therefore cause the sample’s pores to enlarge (swell) (Luque-Garcıa and De Castro, 2003).
Figure 2. Three-dimensional plot of pectin yield as a function of pH and amplitude at constant time.
Figure 3. Three-dimensional plot of pectin yield as a function of time and amplitude at constant pH.
ANN-GA optimization of pectin extraction
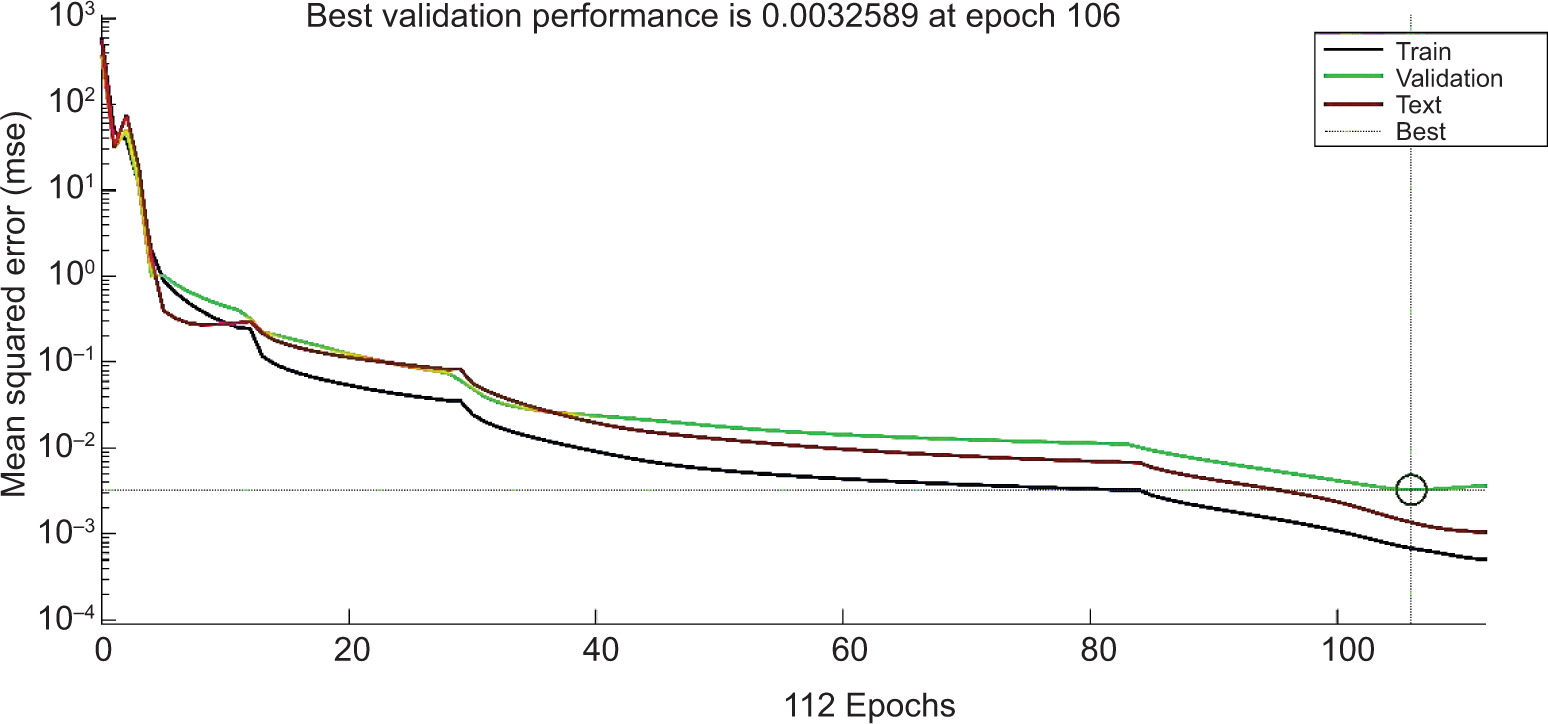
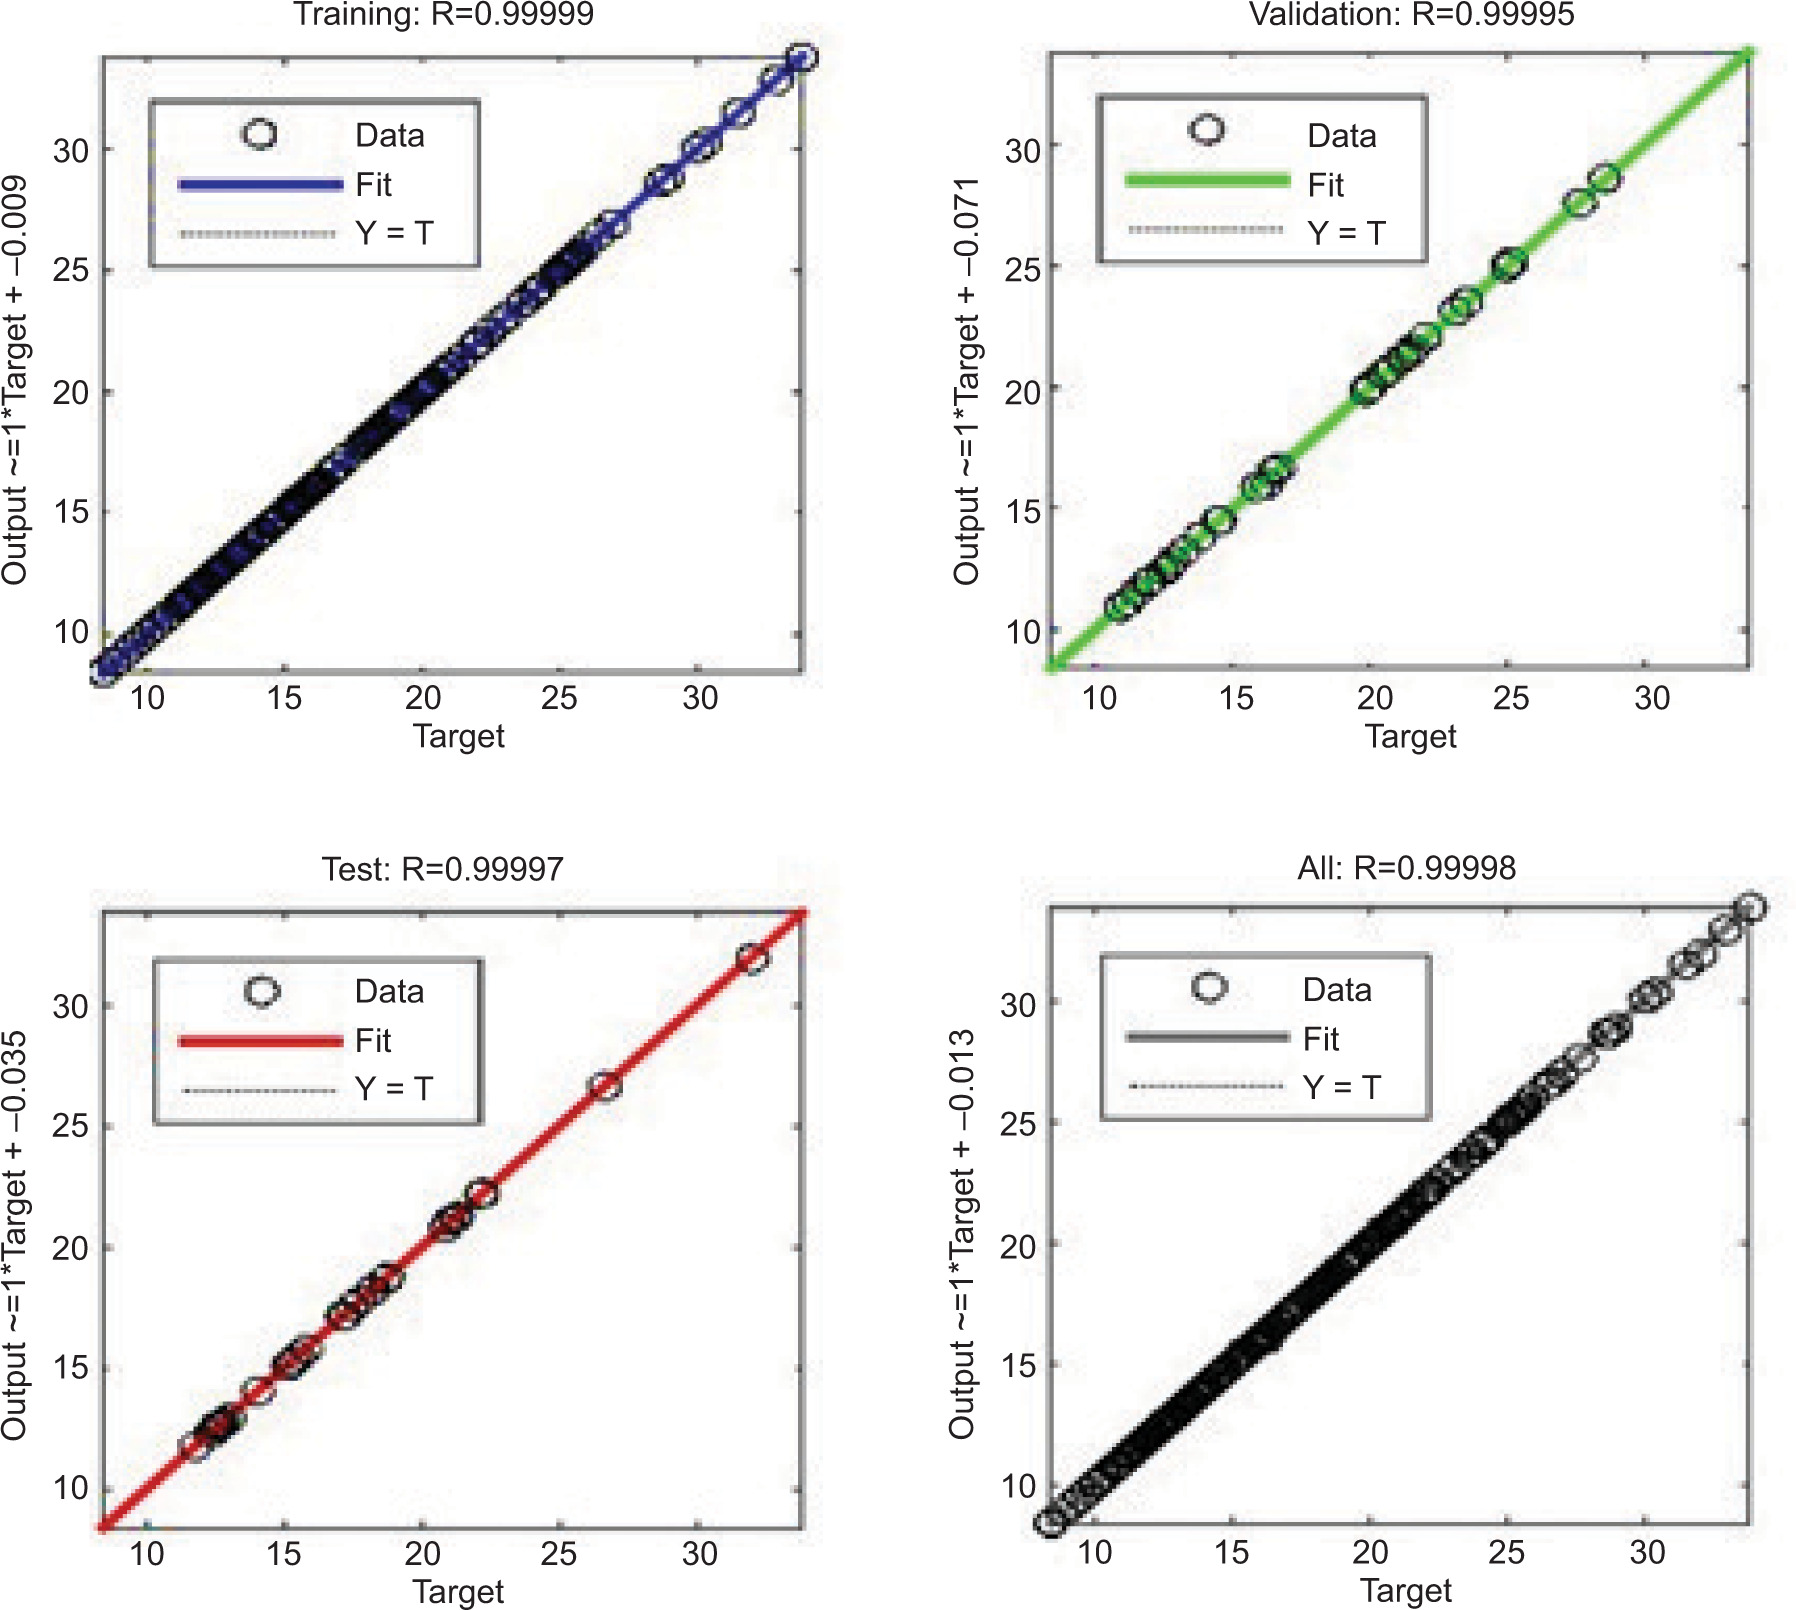
As Figure 4 shows, the least average of mean squared error (MSE) between the predicted output values of the test data is when the hidden layer has three neurons. The best possible design for the pectin ANN involves three input layer neurons, two hidden layers (with m=12 neurons in each hidden layer), and one output layer neuron, as Figure 5 shows. The model demonstrated excellentaccuracy and a strong correlation, as indicated by an R2 of 0.99. Figure 4 demonstrates the convergence of training, revealing the lowest MSE after 112 epochs. Giving a maximum R-value of 0.999 (Figure 5) and a minimum MSE value of 3.25×10⁻³ (Figure 4), the configuration with 12 neurons in the hidden layer utilizing the tangent-sigmoid transfer function was identified. Consequently, the most efficient network architecture, exemplified by the 4-6-1 configuration, was utilized for process optimization. In this configuration, the first layer has three input nodes, the intermediate hidden layer has 12 neurons, and the last layer has one output node. The hidden layer nodes in this investigation were subjected to the tangent-sigmoid transfer function, whereas the output layer node received the application of the pure-linear transfer function. These functions demonstrated the lowest MSE values and the highest R2 values, indicating their remarkable efficiency. In order to prevent overfitting, a large number of datasets were used in the construction of the ANN, and each iteration was preceded by stringent auto-tests and validations.
Figure 4. ANN model performance at the training’s last stage exhibiting an MSE of 0.0032589 at 106 epochs.
Figure 5. Regression plot illustrating the correlation between predicted and experimental output values.
The selection of transfer functions incorporated into the network architecture affects the overall efficacy of the simulated ANN (Amid et al., 2017). Previous studies have shown that choosing the right number of hidden neurons was done carefully since it affects simulation performance and establishes the best possible network layout (Sheela and Deepa, 2013). The modeling process moves slowly when there are few neurons. On the other hand, too many neurons may cause over-fitting, in which the network takes in noise from the training set, reducing the ANN model’s resilience and generalizability. To mitigate over-fitting, regularization techniques can be applied. These techniques introduce a penalty term into the loss function, reducing prediction errors and preventing the over-fitting issue (Xu et al., 2023).
GA optimization
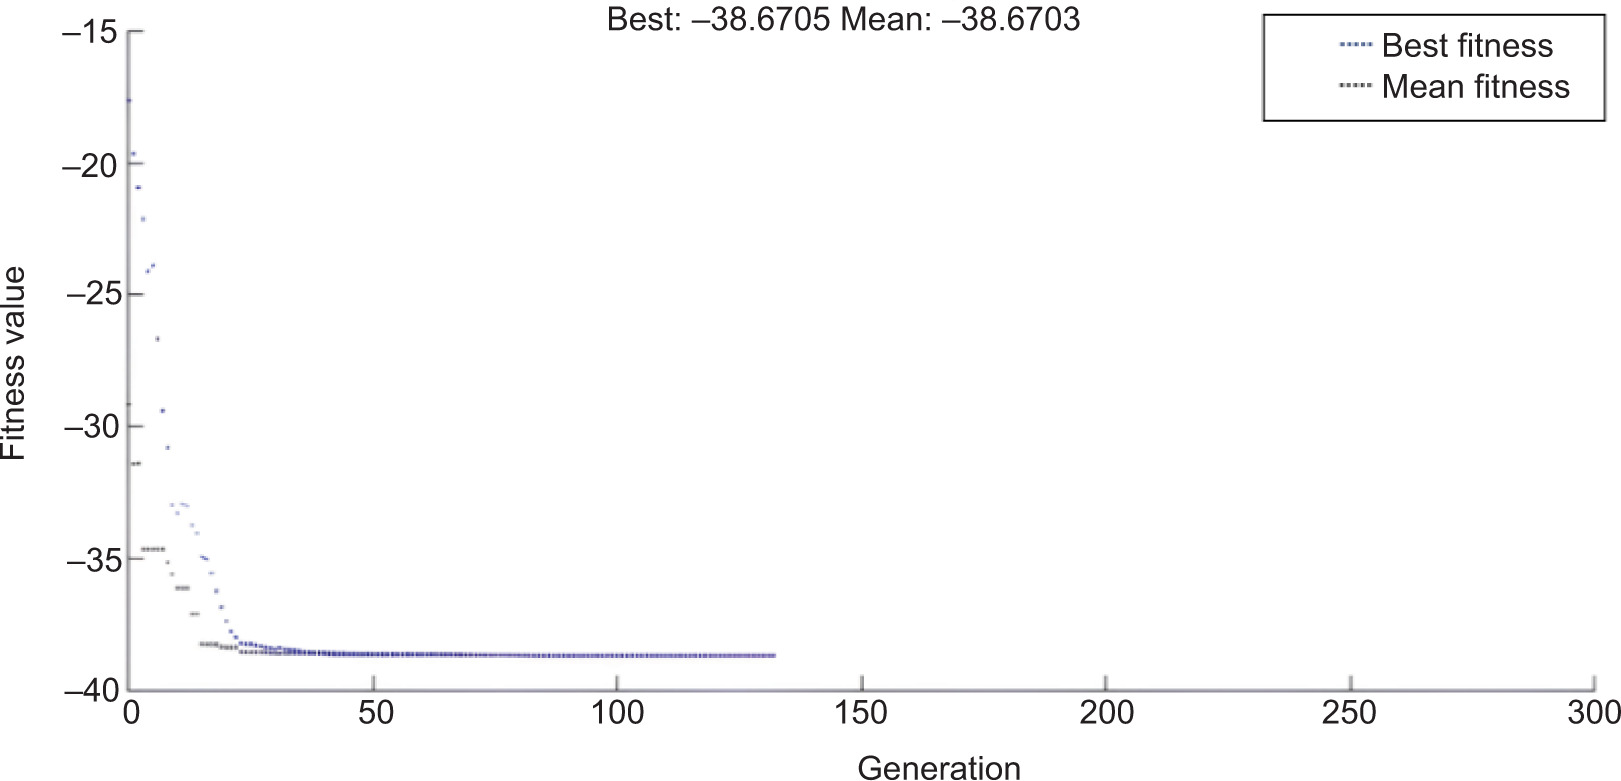
In addition, the ANN model was optimized using the GA technique, and the ideal values of particular parameters were found to produce the maximum pectin output. The GA algorithm employed time, pH, and amplitude as entering factors for optimization; the employed population size was 200. The lower and upper ranges shown in Table 1 were used to select the ideal values for the process variables. The GA optimization was carried out using the “Ga” function available in MATLAB software, with the algorithm par parameters detailed in Table 4. Considering that the MATLAB® GA implementation is intended for minimization tasks, it is significant that the selection function’s output was multiplied by −1. The results indicated a peak pectin level of 38.6705, as illustrated in Figure 6, achieved under the optimized conditions of the three variables.
Table 4. GA configuration for the IAA production model implementation.
| Parameters | Value |
|---|---|
| Population size | 200 |
| Number of elit | 2 |
| Crossing fraction | 1 |
| Migration fraction | 0.2000 |
| Migration interval | 20 |
| Direction of migration | Forwad |
| Stall generation limit | 20 |
| Stall time limit | 20 |
| Plot interval | 1 |
| Generations | 100 |
Figure 6. The best and average fitness (pectin yield) over 100 generations using the GA approach.
Statistical comparison between ANN and RSM models
The efficacy of the models was assessed through modeling and optimizing the extraction of pectin. The training data sets were not the same as the six recently completed sets of experiments. Table 5 provides the actual and predicted response values. Statistical measures including RMSE, R2, and ADD were used to assess the prediction accuracy of the recently created ANN and RSM models (Shanmugaprakash and Sivakumar, 2013).
Table 5. Optimal conditions with predicted and experimental response values.
| Factor Unit | Actual value of predicted Optimum | Predicted max. Y-value (%) | Desirability | Experimental Y-value (%) |
|---|---|---|---|---|
| RSM-BBD | ||||
| pH | 4.2 | 39.77 | 1 | 40.23 |
| Time (min) | 60 | |||
| Amplitude (%) | 25 | |||
| ANN-GA | ||||
| pH | 1.2 | 38.67 | 38.92 | |
| Time (min) | 30 | |||
| Amplitude (%) | 50 |
The ANN-GA presents higher prediction accuracy in terms of pectin response prediction, the higher R2 and the lower MSE compared to RSM, regarding the neglected possibility of the model getting into overfitting or underfitting after optimization. This performance is attributed to the overall ability of ANN-GA to analyze the nonlinear behavior of the system. At the same time, the response surface model is limited by second-order polynomial regression. Therefore, these findings confirm the suitability of the ANN-GA-assisted modulization as an alternative to RSM-based models in predicting pectin production.
The noteworthy pectin yield achieved under optimal conditions adds substantial credibility to the study and enhances the raw material’s profitability. This outcome validates the accuracy of both ANN and RSM models in predicting and optimizing the extraction of pectin. Moreover, it demonstrates the effective valorization of lemon peels with minimal experimental setup, reducing reagent consumption and consequently lowering effluent treatment costs. This approach plays a significant role in optimizing the nation’s economy.
FT-IR (ATR)
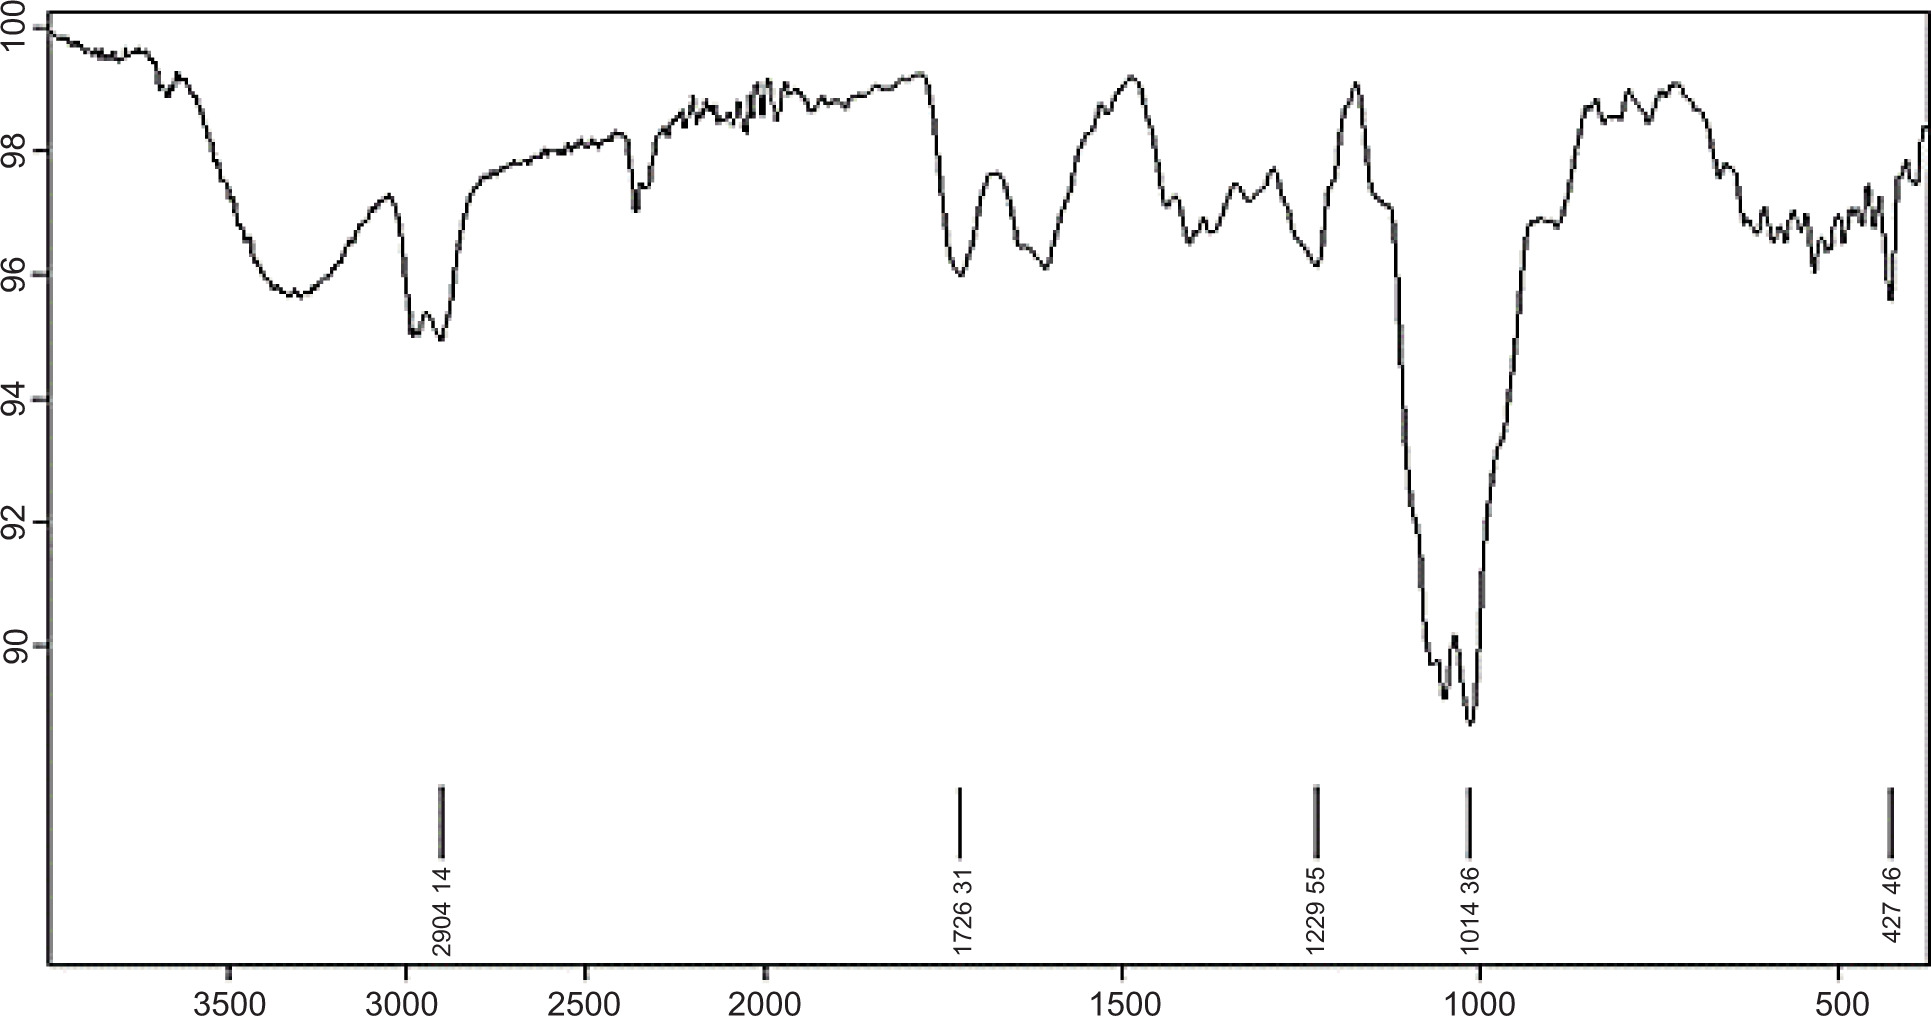
The ultrasonically extracted pectin’s FTIR spectra are depicted in Figure 7. The main chemical groups in the pectin were determined by FTIR spectra in the range of 1000–2000 cm−1 (Kalapathy and Proctor, 2001). The reference region for carbohydrates is thought to be the wavelength range of 950–1200 cm-1 in FT-IR spectra because it makes it possible to identify the main chemical groups in polysaccharides. The spectrum displays characteristic bands at 2904.14 cm−1 corresponding to C-H vibrations, indicative of a carbohydrate ring structure, along with a significant C=O stretching vibration for the COOMe group observed in the range of1710 –1665 cm−1. The strong peak in the range of 1014.36 cm−1 suggests the stretching vibration of alcohols, carboxylic acids, and esters.
Figure 7. FTIR-ATR spectra of ultrasonically extracted pectin.
Furthermore, the emergence of peaks at 1728.22 and 1242.16 cm−1 indicates the existence of functional groups associated with aliphatic amines and unsaturated esters (Kanmani et al., 2014). The esterification degree of pectin was determined to be 42.23% based on the surface areas of the peaks that were located at 1740 and 1630 cm−1. Low esterification degree (DE<50) of the pectin was discovered.
According to Ciriminna et al. (2017) The DE varies according to the source, with pectin derived from lemon waste (exo-, meso-, and endocarp) having a maximum of 40% and pectin from lemon exocarp having a minimum of 24%. The pectin of grapefruits and red oranges (Citrus sinensis) have intermediated DE values. In addition, in red orange pectin, the DE rises from waste to the outer peel.
This implies that the pectin from the red orange pulp must contribute significantly and have a very low DE (compared to the pectin of blond Valencia orange). On the other hand, the waste of lemon pectin had the highest DE and the outer skin the lowest. Remarkably, pectin obtained from the peel exhibits comparable levels of esterification (about 30%) regardless of the fruit. Specifically, high-quality pectinis identifies as anappropriate for use as food additives, particularly in the formulation of low-fat products. In addition,the gelling mechanisms of pectin and its gel strength are significantly influenced by the degree of esterification (DE) (Singthong et al., 2004).
Pectin (E440), which has gelling and thickening qualities, istypically employed as food additive in jams, confections, etc. High-ester pectin is utilized in traditional jams that contain more than 60% sugar and soluble fruit solids due totheir reduced sugar requirements, amidated and low-ester pectincan be effectively utilized in the formulation of diet-oriented meals (Sundarraj and Ranganathan, 2017).
Scanning electron microscope (SEM)
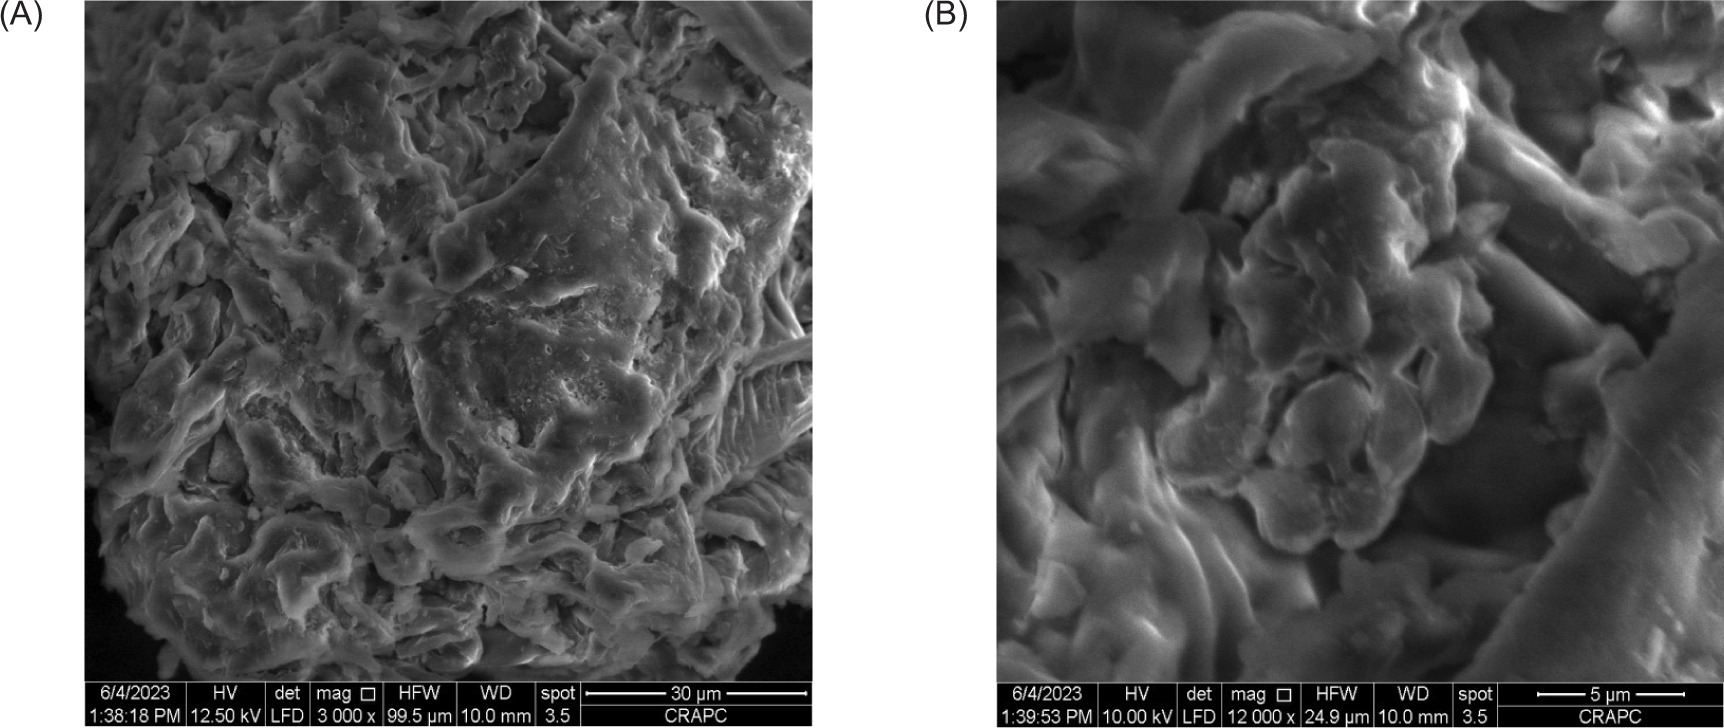
Figure 8 presents the SEMimage of the extracted pectin obtained under various experimental conditions using ultrasound. The SEM image reveals irregular and filamentous structures within the pectin sample. It is noteworthy that the type of raw material utilized and the extraction circumstances can have an impact on the surface shape of the extracted pectin.
Figure 8. The SEM image of pectin obtained under different experimental conditions utilizing ultrasound (A and B).
Conclusion
In this research study, the process of ultrasonic pectin extraction was optimized by employing RSM and ANN-GA; various process variables were optimized, and in-depth investigations were carried out to understand the interactions among these variables. The extracted pectin under went comprehensive characterization, evaluating its chemical functionality using FTIR-ATR and its morphology through SEM. Under these optimized conditions, the DE was identified to be 42.23%, classifying the extracted pectin as low methoxyl pectin. This study underscores the effectiveness of ultrasonication as a highly efficient method for the extraction of pectin, resulting in the highest yield. The obtained pectin, characterized as low methoxyl pectin, holds significant promise for a wide array of biotechnological applications. This study advances the science of pectin extraction while providing valuable insights into the potential applications of the extracted pectin across varioussettings and sectors including the foods and agriculture, biotechnology, pharmaceuticals, cosmetics, and textiles.
Acknowledgments
This research study was supported financially by the Directorate-General for Scientific Research and Technological Development (DGRSDT), Algeria. The authors extend their appreciation to Taif University, Saudi Arabia, for supporting this work through project number (TU-DSPP-2024-79).
Authors Contributions
All authors contributed equally to this work.
Conflicts of Interest
The authors declare no conflict of interest.
Funding
This research was funded by Taif University, Saudi Arabia, Project No. (TU-DSPP-2024-79).
REFERENCES
Amid S., and Gundoshmian T.M. 2017. Prediction of output energies for broiler production using linear regression, ANN (MLP, RBF), and ANFIS models. Sustainable Energy. 36: 577–585. 10.1002/ep.12448
Anticona M., Blesa J., Frigola A., and Esteve M.J. 2020. High biological value compounds extraction from citrus waste with non-conventional methods. Foods. 9: 811. 10.3390/foods9060811
Ardra S., and Barua M.K. 2022. Halving food waste generation by 2030: The challenges and strategies of monitoring UN sustainable development goal target 12.3. J. Clean. Prod. 380: 135042. 10.1016/j.jclepro.2022.135042
Bahmani L., Aboonajmi M., Arabhosseini A., and Mirsaeedghazi H. 2018. ANN modeling of extraction kinetics of essential oil from tarragon using ultrasound pre-treatment. Eng. Agric. Environ. Food. 11: 25–29. 10.1016/j.eaef.2017.10.003
Belan D., and Israel K. Effect of extraction temperature, pH, and time on pectin yield of katmon (Dilleniaphilippinensis Rolfe). Proceedings of the International Food Research Conference.
Bouizzar S., Berkani M., Kebaili F.F., Barceló D., Joo S.W., Vasseghian Y., et al. 2023. Dicamba degradation using a low-cost chlorine/ferrous-based AOP: ANN-PSO model development, intermediate identification, and toxicity assessment using microalgae. Ind. Eng. Chem. Res. 62: 12891–12903. 10.1021/acs.iecr.3c01743
Ciriminna R., Fidalgo A., Delisi R., Tamburino A., Carnaroglio D., Cravotto G., et al. 2017. Controlling the degree of esterification of citrus pectin for demanding applications by selection of the source. ACS Omega. 2: 10.1021/acsomega.7b01109
Dao T.A.T., Webb H.K., and Malherbe F. 2021. Optimization of pectin extraction from fruit peels by response surface method: Conventional versus microwave-assisted heating. Food Hydrocolloids. 113: 106475. 10.1016/j.foodhyd.2020.106475
Dranca F., and Oroian M.J.P. 2019. Ultrasound-assisted extraction of pectin from Malusdomestica ‘Fălticeni’ Apple Pomace. Processes. 7: 488. 10.3390/pr7080488
Eça K.S., Machado M.T.C, Hubinger M.D., and Menegalli F.C. 2015. Development of active films from pectin and fruit extracts: Light protection, antioxidant capacity, and compounds stability. J. Food Sci. 80: C2389–C2396. 10.1111/1750-3841.13074
Fierascu R.C., Sieniawska E., Ortan A., Fierascu I., and Xiao J. 2020. Fruits by-products-A source of valuable active principles. A short review. Frontiers. 8: 319. 10.3389/fbioe.2020.00319
Hamidon N.H., and Zaidel D.N.A. 2017. Effect of extraction conditions on pectin yield extracted from sweet potato peels residues using hydrochloric acid. Chemical Eng. Trans. 56: 979–984. 10.3303/CET1756164
He C., Sampers I., and Raes K. Isolation of pectin from clementine peel: A new approach based on green extracting agents of citric acid/sodium citrate solutions. ACS Sustainable Chem. & Engin. 9: 833–843. 10.1021/acssuschemeng.0c07422
Hu W., Ye X., Chantapakul T., Chen S., and Zheng J. 2020. Manosonication extraction of RG-I pectic polysaccharides from citrus waste: Optimization and kinetics analysis. Carbohydrate Poly. 235: 115982. 10.1016/j.carbpol.2020.115982
Hundie K.B. 2020. Ultrasound-assisted optimization of pectin extraction from orange peel using Response Surface Methodology (RSM) and Artificial Neural Network (ANN). IJASE. 8(2): 69–87. 10.30954/2322-0465.2.2020.1
Kadmi Y., Ousaadi M.I., Lakhdari D., Bachiri N., Bouta, I., Bouizzar, S., et al. 2023. Optimization of azithromycin degradation: Integrating ANN-PSO modeling, intermediates analysis, identification, and microbiological assessment. J of the Taiwan Inst. Chem. Engineers. 105086. 10.1016/j.jtice.2023.105086
Kalapathy U., and Proctor A. 2001. Effect of acid extraction and alcohol precipitation conditions on the yield and purity of soy hull pectin. Food Chem. 73(4): 393–396. 10.1016/S0308-8146(00)00307-1
Kalal P., Mani A., Kuchi V.S., Mandal, D. Citrus. In Tropical and Subtropical Fruit Crops (pp. 63–160). 2023. Apple Academic Press. 10.1201/9781003305033-2
Kanmani P., Dhivya E., Aravind J., and Kumaresan K. 2014. Extraction and analysis of pectin from citrus peels: Augmenting the yield from Citrus limon using statistical experimental design. Iranica J. Energy & Envir. 5(3): 303–312. 10.5829/idosi.ijee.2014.05.03.10
Kulkarni S., Vijayanand P.J.L.F.S., Technology, 2010. Effect of extraction conditions on the quality characteristics of pectin from passion fruit peel (Passifloraedulis f. flavicarpa L.). 43: 1026–1031. 10.1016/j.lwt.2009.11.006
Lara-Espinoza C., Carvajal-Millán E., Balandrán-Quintana R., López-Franco Y., and Rascón-Chu A. 2018. Pectin and pectin-based composite materials: Beyond food texture. Molecules. 23(4): 942. 10.3390/molecules23040942
Lasunon P., and Sengkhamparn N. 2022. Effect of ultrasound-assisted, microwave-assisted and ultrasound-microwave-assisted extraction on pectin extraction from industrial tomato waste. Molecules. 27(4): 1157. 10.3390/molecules27041157
Liew S.Q., Ngoh G.C., Yusoff R., and Teoh W.H. 2016. Sequential ultrasound-microwave assisted acid extraction (UMAE) of pectin from pomelo peels. Inter. J of Biolo. Macromole. 93: 426–435. 10.1016/j.ijbiomac.2016.08.065
Luque-Garcıa J.L., and de Castro M.D.L. 2003. Ultrasound: A powerful tool for leaching. TrAC Trends in Analy. Chem. 22(1): 41–47. 10.1016/S0165-9936(03)00102-X
Luque R., and Clark, J.H. 2013. Valorisation of food residues: Waste to wealth using green chemical technologies. Sustainable Chemical Proces. 1: 1–3. 10.1186/2043-7129-1-10
Mamiru D., and Gonfa G. 2023. Extraction and characterization of pectin from watermelon rind using acetic acid. Heliyon. 9(2): e13525. 10.1016/j.heliyon.2023.e13525
Maran J.P., and Prakash K.A. 2015. Process variables influence on microwave assisted extraction of pectin from waste Carcia papaya L. peel. Inter. J of Biolo. Macromole. 73: 202–206. 10.1016/j.ijbiomac.2014.11.008
Muthusamy S., Manickam L.P., Murugesan V., Muthukumaran C., Pugazhendhi A. 2019. Pectin extraction from Helianthus annuus (sunflower) heads using RSM and ANN modelling by a genetic algorithm approach. Inter. J of Biolo. Macromole. 124: 750–758. 10.1016/j.ijbiomac.2018.11.036
Pandharipande S., and Makode H. 2012. Separation of oil and pectin from orange peel and study of effect of pH of extracting medium on the yield of pectin. J Eng Res Stud. 3(2):6–9.
Pradhan D., Abdullah S., Pradhan R.C. 2020. Optimization of pectinase assisted extraction of Chironji (Buchananialanzan) fruit juice using response surface methodology and artificial neural network. Inter. J. of Fruit Sci. 20(sup2): S318–S336. 10.1080/15538362.2020.1734895
Saberian H., Hamidi-Esfahani Z., Ahmadi Gavlighi H., Banakar A., Barzegar M. 2018. The potential of ohmic heating for pectin extraction from orange waste. J. Food Process. & Preservation. 42(2): e13458. 10.1111/jfpp.13458
Salma M.A., Jahan N., Islam M.A., and Hoque M.M. 2012. Extraction of pectin from lemon peel: Technology development. J. Chem. Engineer. 27(2): 25–30. 10.3329/jce.v27i2.17797
Shanmugaprakash M., and Sivakumar V. 2013. Development of experimental design approach and ANN-based models for determination of Cr (VI) ions uptake rate from aqueous solution onto the solid biodiesel waste residue. Bioresource Technol. 148: 550–559. 10.1016/j.biortech.2013.08.149
Sheela K.G., and Deepa S.N. 2013. Review on methods to fix number of hidden neurons in neural networks. Mathematical Problems in Engineer. 1–11. 10.1155/2013/425740
Simić V.M., Rajković K.M., Stojičević S.S., Veličković D.T., Nikolić N.Č., Lazić M.L., and Karabegović I.T. 2016. Optimization of microwave-assisted extraction of total polyphenolic compounds from chokeberries by response surface methodology and artificial neural network. Separation and Purification Technol. 160: 89–97. 10.1016/j.seppur.2016.01.019
Singthong J., Cui S.W., Ningsanond S., and Goff H.D. 2004. Structural characterization, degree of esterification and some gelling properties of Krueo Ma Noy (Cissampelos pareira) pectin. Carbohydr. Polym. 58(4): 391–400. 10.1016/j.carbpol.2004.07.018
Smaali A., Berkani M., Benmatti H., Lakhdari N., Al Obaid S., Alharbi S.A., et al. 2022. Degradation of Azithromycin from aqueous solution using Chlorine-ferrous-oxidation: ANN-GA modeling and Daphnia magna biotoxicity test assessment. Environ. Res. 214: 114026. 10.1016/j.envres.2022.114026
Suhaimi S.H., Hasham R., Idris M.K.H, Ismail H.F., Mohd Ariffin N.H., and Majid, F.A.A. 2019. Optimization of ultrasound-assisted extraction conditions followed by solid phase extraction fractionation from Orthosiphon stamineus Benth (Lamiace) leaves for antiproliferative effect on prostate cancer cells. Molecules. 24(22): 4183. 10.3390/molecules24224183
Sundarraj A.A., and Ranganathan T.V. 2017. A review-Pectin from agro and industrial waste. Int. J. Appl. Environ. Sci. 12: 1777–1801.
Van Hung P., Anh M.N.T., Hoa P.N., Phi N.T.L. 2021. Extraction and characterization of high methoxyl pectin from Citrus maxima peels using different organic acids. J. of Food Measurement and Characterization. 15: 1541–1546. 10.1007/s11694-020-00748-y
Vasseghian Y., Moradi M., Pirsaheb M., Khataee A., Rahimi S., Badi M.Y., et al. 2020. Pesticide decontamination using UV/ferrous-activated persulfate with the aid neuro-fuzzy modeling: A case study of Malathion. Food Res. Int. 137: 109557. 10.1016/j.foodres.2020.109557
Xu G., Ji C., Xu Y., Yu E., Cao Z., Wu Q., Lin P., and Wang J. 2023. Machine learning in coastal bridge hydrodynamics: A state-of-the-art review. Appl. Ocean Res. 134: 103511. 10.1016/j.apor.2023.103511
Yerena-Prieto B.J., Gonzalez-Gonzalez M., Vázquez-Espinosa M., González-de-Peredo A.V., García-Alvarado M.Á., Palma M., et al. 2022. Optimization of an ultrasound-assisted extraction method applied to the extraction of flavonoids from moringa Leaves (Moringa oleífera Lam.). Agronomy. 12(2): 261. 10.3390/agronomy12020261