
Download
PAPER
Quality of frozen stored flavoured olive oils
Giacomo Squeo1*, Graziana Difonzo1, Antonietta Baiano2, Roccangelo Silletti1, Antonella Pasqualone1, Carmine Summo1, Francesco Caponio1
1Department of Soil Plant and Food Sciences, University of Bari “Aldo Moro”, Via Amendola, Bari, Italy;
2Dipartimento di Scienze Agrarie, Alimenti, Risorse Naturali e Ingegneria (DAFNE), University of Foggia, Via Napoli, Foggia, Italy
Abstract
The purpose of the current research was to study the effects of 6-month frozen storage on the quality parameters and the phenolic profiles of flavoured olive oils (FOO) produced by co-malaxation or infusion using basil, chilli, or chilli–garlic as flavouring ingredients. The results demonstrated that during frozen storage, FOOs underwent degradative processes that caused a progressive depletion of phenolic compounds and the rising of oxidative and hydrolytic markers. A clear interaction appeared between storage time, flavouring ingredient and flavouring technique. Infusion caused a greater quality loss than co-malaxation, and in basil flavoured oils the drawbacks of infusion were greater than in other flavoured oils. The impact of flavouring method on the phenolic profiles of oil became more evident at the end of the storage period. It was confirmed that oleocanthal is less affected by storage in freezing conditions than other secoiridoids.
Key words: freezing, infusion, malaxation, phenolic compounds, spices, virgin olive oil
*Corresponding Author: Giacomo Squeo, Department of Soil Plant and Food Sciences, University of Bari “Aldo Moro”, Via Amendola, Bari, Italy. Email: [email protected]
Received: 2 December 2021; Accepted: 11 January 2022; Published: 27 January 2022
© 2022 Codon Publications
This is an Open Access article distributed under the terms of the Creative Commons Attribution-NonCommercial-ShareAlike 4.0 International (CC BY-NC-SA 4.0). License (http://creativecommons.org/licenses/by-nc-sa/4.0/)
Introduction
Aromatic plants have been used since ancient times as food flavouring ingredients as well as in pharmaceutical, cosmetic and perfumery because of the presence of essential oils. Several biological activities, including antimicrobial and antioxidant properties, are assigned to these plants and derived oils or to some of their other constituents (Ayadi et al., 2009; Ijaz Hussain et al., 2008). Along the Mediterranean basin, spices and herbs have been historically used in association with olive oil, as it represented the main source of fats in the area, to improve its nutritional and organoleptic properties (Baiano et al., 2010). Over the time, the importance gained by high-quality virgin olive oils (VOO) has been the driving force for a renewed interest towards flavoured olive oils (FOO), which have been rediscovered as interesting products with unique characteristics as well as these being increasingly appreciated by consumers. Flavouring represents a strategy to increase the use of olive oil among non-traditional consumers for adding value to its organoleptic and good health properties (Perestrelo et al., 2017). In this perspective, FOOs represent an important source of income for producers and sellers.
Oil flavouring is performed by different techniques such as: (i) infusion (Akçar and Gümüşkesen 2011; Ayadi et al., 2009; Baiano et al., 2016; Caporaso et al., 2013; Damechki et al., 2001; Issaoui et al., 2011; Sousa et al., 2015); (ii) ultrasound-assisted maceration (Veillet et al., 2010) and (iii) direct malaxation of olive paste with spices (Baiano et al., 2009; Caponio et al., 2016). The last mentioned technique does not require the implementation of additional equipment in the olive oil mills, and is time-saving without the disadvantages of the other cited methods. In fact, it is reported that ultrasound-assisted technology could determine the off-flavour onset because of the oxidative oil degradation (Chemat et al., 2004), while infusion is time-consuming and could compromise the quality of olive oil. Previous research conducted by the present authors (Caponio et al., 2016) highlighted that malaxation was more effective in extracting phenolic compounds, with a significantly lower level of hydrolysis of secoiridoids than that occurring with infusion. Moreover, FOOs produced by infusion showed lower antioxidant activity and higher extent of oxidative degradation. Volatile compounds, in generally, were not significantly influenced by the adopted flavouring method. Clodoveo et al. (2016) reported that an ultrasound treatment of olive paste mixed with herbs before malaxation determined a higher level of total phenols as well as tyrosol, hydroxytyrosol and oleuropein derivatives in flavoured oils. Yilmazer et al. (2016) reported that only the amount of spices influenced the partition of target compounds in FOOs whereas temperature and time of malaxation did not exercise significant effects.
Quality of FOOs is also affected by storage (Ayadi et al., 2009; Baiano et al., 2009; Gambacorta et al., 2007; Issaoui et al., 2011). During storage, FOOs undergo the same degradative processes that commonly affect the quality of VOOs, which are, in turn, dependent on light, oxygen, temperature, water, metals and antioxidants (Choe and Min, 2006). Effects of light, oxygen, metals and water could be controlled by using proper packaging materials and process settings during the extraction process (e.g. settings of the vertical centrifuge, filtration etc.). On the other hand, temperature could be easily managed during storage. Although low-temperature storage could slow down the rate of degradative phenomena, studies on the quality of VOOs stored at low or freezing temperature reported contradictory results, especially considering the fate of phenolic compounds (Cerretani et al., 2005; Li et al., 2014; Mousavi et al., 2021; Mulinacci et al., 2013). However, a study conducted on the subject has highlighted that FOOs stored under freezing conditions and the interactions between storage time and flavouring method and ingredients have been poorly investigated.
In the light of these considerations, our work was aimed at studying changes in the quality features of three different FOOs (basil, chilli, and chilli and garlic) obtained by applying two flavouring methods (co-malaxation and infusion) during 6 months of frozen storage in comparison to unflavoured stored VOOs.
Material and Methods
Sampling
A blend of olives (Olea europaea L.) from Peranzana, Coratina and Ogliarola cvs (50%, 30% and 20% w/w, respectively) was used for the experimental trials carried out at a local olive mill (Olearia Clemente, Manfredonia, Italy). Olives were processed by a continuous extraction process. After crushing, the olive paste was malaxed for 30 min at 26°C without any flavouring ingredient to produce the control oil (CTR). Co-malaxed (M) FOOs were produced by direct addition of dried basil (B), dried chili (C), and a combination of dried chili and garlic (CG) during malaxation (30 min at 26°C). The amount of spices used were 5%, 20% and 20% + 10% w/w with respect to the amount of olive processed by addition of dried basil, dried chili, and dried chili and garlic, respectively. To produce FOOs by infusion, the same extraction process as for the control oil was followed. Then the spices were left in infusion (with daily stirring) at 15–18°C for 15 days in the case of oils processed by dried basil and for 7 days in the case of chili and dried chili and garlic. The optimal amount of each flavouring ingredient was identified in preliminary trials based on the best sensory result.
Both CTR and FOOs were stored under freezing conditions (–18°C) and sampled after 3 (T3) and 6 (T6) months. Three independent trials were carried out for each flavouring method, starting from the same olive oil batch.
Routine analyses
Free fatty acid (FFA), peroxide value (PV), and spectrophotometric indices (K232, K270 and ΔK) were determined following the analytical methods described by the European Community Regulation (EEC) Regulation 2568/91 and subsequent integrations and amendments (European Commission, 1991).
Extraction of phenolic fraction and determination of phenolic profile
The extraction of phenolic compounds and the quantification of total phenolic content (TPC) were carried out according to the procedure described in Zago et al. (2019). TPC was expressed as milligrams of gallic acid equivalents per kilogram of oil. The high-performance liquid chromatography (HPLC) analysis of phenolic extracts was carried out according to Baiano et al. (2009). The stationary phase was a Nova-Pack C18 analytical column (150 × 3.9 mm i.d.) with a particle size of 4 μm (Waters, Milford, MA). The mobile phases were (a) water:acetic acid (98:2, v/v) and (b) methanol:acetonitrile (1:1, v/v) at a constant flow rate of 1 mL/min, according to the following gradient programs: 0–30 min 100% mobile phase (a); 30–45 min, 70% mobile phase (); 45–55 min, 50% mobile phase (a); 55–65 min, 40% mobile phase (a); and 65–75 min, 0% mobile phase (a). Phenolic compounds were quantified according to the method of the internal standard considering the response factors, and identification was carried out comparing peak retention period and spectra with those of pure standards.
Determination of polar compounds
Polar compounds (PCs) were first separated by silica gel column chromatography, according to the Association of Official Analytical Chemists (AOAC) method No. 982.27. The efficacy of the separation was checked by thin layer chromatography (TLC) as recommended by the AOAC. The polar compounds, recovered in tetrahydrofuran (THF), were then analysed by high-performance size-exclusion chromatography (HPSEC) following the conditions reported by Makhlouf et al. (2021).
Data elaboration
The paired t-test was used to compare the characteristics of oils after 3- and 6-month storage with respect to the time of production. The statistical analysis was carried out with Minitab 17 (Minitab Inc., State College, PA) at a significance level of 0.05. Principal component analysis (PCA) was carried out on the autoscaled data matrix and used as a multivariate tool for data exploration. PCA was carried out in Matlab environment (The MathWorks Inc. MA) by using the PLS_toolbox (Eigenvector Research Inc., USA).
Results and Discussion
The effect of storage on FOOs has been studied by several authors (Ayadi et al., 2009; Baiano et al., 2009; Gambacorta et al., 2007; Issaoui et al., 2011) but without considering the frozen storage. Taking into consideration the frozen storage, the first aim of the present research was to highlight the effect of freezing on quality parameters, the polar compounds and the TPC of FOOs sampled for 3 and 6 months after production. Table 1 shows the significance of the differences in the quality characteristics of T3 and T6 samples with respect to T0. After 3 months, the effect of storage on the characteristics of FOOs was different according to the flavouring method. In fact, in the case of infusion (I-oils), a significant increase in the value of several quality parameters (FFA, PV, spectrophotometric constants and polar compounds) was observed with respect to T0 although with some differences linked to the spice. Notably, the TPC always decreased significantly. On the other hand, after 3-month frozen storage, the characteristics of FOOs from co-malaxation (M-oils) were less affected. Only in the case of co-malaxation with chilli–garlic as flavouring ingredient (M-CG), a significant increase was observed in oxidated triacylglycerols (ox-TAG). However, even in this case, the TPC was always negatively affected by storage. At T6, main differences with the oils at production were the significant increase in polar compounds (in particular, ox-TAG) and depletion of TPC. Other differences were highlighted in the FFA, PV, and spectrophotometric constants. The paired t-test afforded to point out differences in characteristics of oils because of storage. However, it did not show the magnitude of these effects and also did not allow considering the complexity of the evolution of features of oils during freeze storage. For this, the data were explored by PCA, and the results are reported in Figure 1.
Table 1. Statistical significance, expressed as p-value, of the differences in the characteristics of the samples between T3 or T6 and T0.
| FFA | PV | K232 | K270 | ΔK | TAGP | ox-TAG | DAG | PC | TPC | |
|---|---|---|---|---|---|---|---|---|---|---|
| T3 vs. T0 | ||||||||||
| CTR | 0.99 | 0.01↑ | 0.54 | 0.86 | 0.18 | 0.05↑ | 0.01↑ | 0.01↑ | 0.00↑ | 0.01↓ |
| I-B | 0.31 | 0.00↑ | 0.41 | 0.00↑ | 0.19 | 0.48 | 0.00↑ | 0.05↑ | 0.01↑ | 0.00↓ |
| I-C | 0.01↑ | 0.01↑ | 0.29 | 0.13 | 0.10 | 0.01↑ | 0.03↑ | 0.26 | 0.05↑ | 0.01↓ |
| I-CG | 0.11 | 0.00↑ | 0.07 | 0.03↑ | 0.01↑ | 0.35 | 0.07 | 0.04↑ | 0.03↑ | 0.04↓ |
| M-B | 0.21 | 0.20 | 0.30 | 0.16 | 0.06 | 0.90 | 0.07 | 0.16 | 0.13 | 0.02↓ |
| M-C | 0.95 | 0.65 | 0.19 | 0.21 | 0.30 | 0.16 | 0.05 | 0.29 | 1.00 | 0.03↓ |
| M-CG | 0.87 | 0.13 | 0.51 | 0.09 | 0.45 | 0.63 | 0.03↑ | 0.11 | 0.09 | 0.00↓ |
| T6 vs. T0 | ||||||||||
| CTR | 0.16 | 0.24 | 0.63 | 0.01↓ | 0.42 | 0.06 | 0.00↑ | 0.11 | 0.02↑ | 0.00↓ |
| I-B | 0.67 | 0.00↑ | 0.20 | 0.08 | 0.39 | 0.60 | 0.00↑ | 0.01↑ | 0.02↑ | 0.00↓ |
| I-C | 0.36 | 0.06 | 0.01↑ | 0.02↑ | 0.68 | 0.25 | 0.01↑ | 0.25 | 0.02↑ | 0.00↓ |
| I-CG | 0.07 | 0.27 | 0.05↑ | 0.02↑ | 0.07 | 0.48 | 0.02↑ | 0.10 | 0.05 | 0.00↓ |
| M-B | 0.73 | 0.01↓ | 0.07 | 0.26 | 0.00↑ | 0.68 | 0.01↑ | 0.00↑ | 0.02↑ | 0.06 |
| M-C | 0.02↑ | 0.13 | 0.02↑ | 0.07 | 0.02↑ | 0.11 | 0.01↑ | 0.26 | 0.60 | 0.00↓ |
| M-CG | 0.02↑ | 0.04↓ | 0.19 | 0.07 | 0.42 | 0.70 | 0.02↑ | 0.05↓ | 0.05↑ | 0.00↓ |
CTR: unflavoured oils (control); I: infusion; M: co-malaxation; B: basil; C: chilli; CG: chilli and garlic; FFA: free fatty acids; PV: peroxide value; TAGP: triacylglycerol oligopolymers; ox-TAG: oxidated triacylglycerols; DAG: diacylglycerols; PC: total polar compounds; TPC: total phenolic content.
Significant differences (p ≤ 0.05) are highlighted in bold. Up arrows and down arrows indicate respective significant increase and decrease with respect to T0.
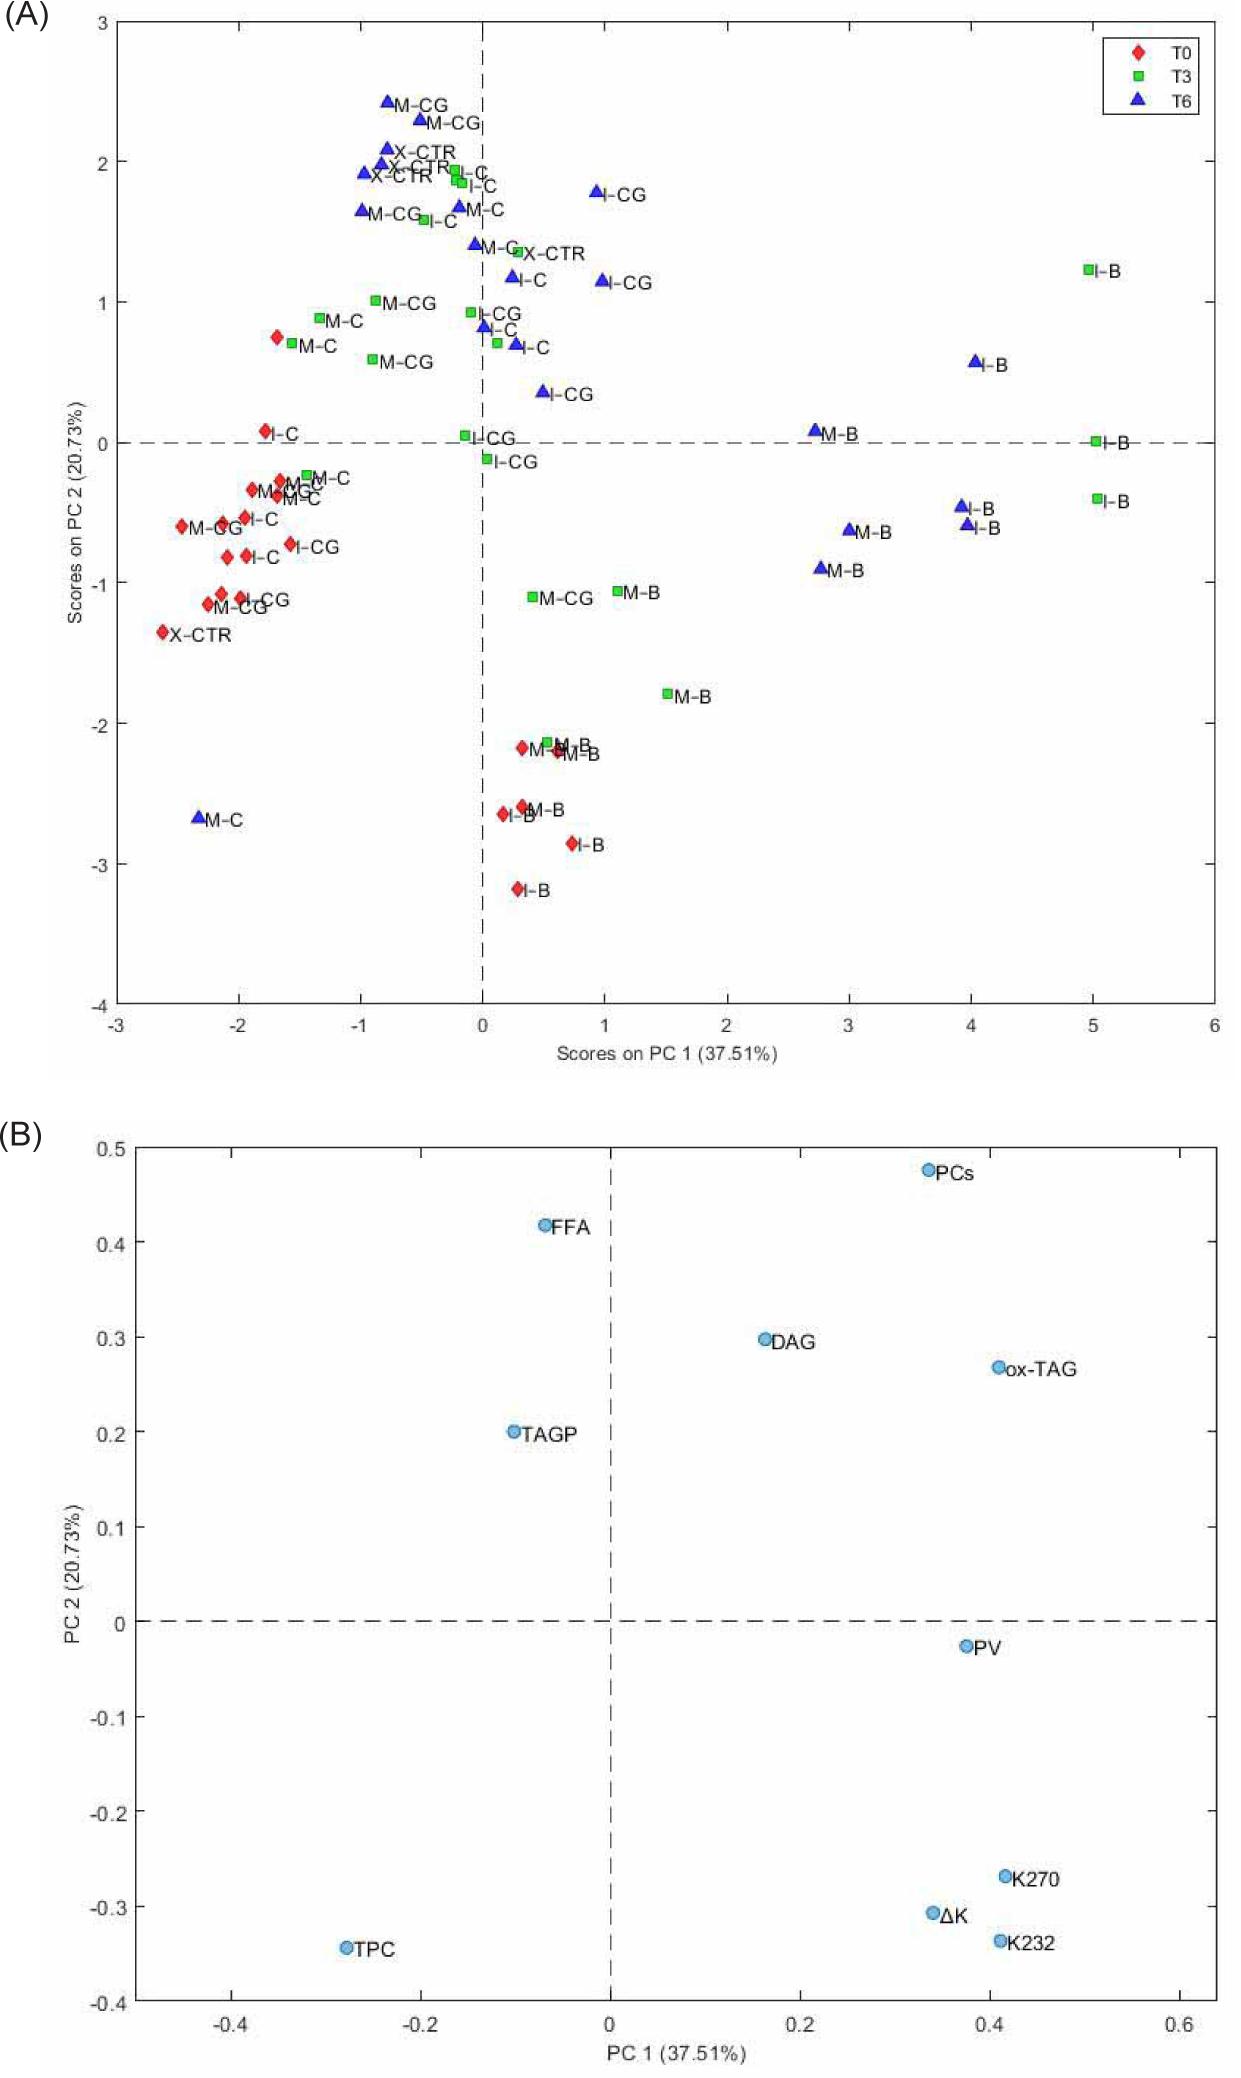
Figure 1. (A) Score plot and (B) loading plot of PCA carried out on quality indices, polar compounds, and total phenolic content of stored flavoured (B, C and CG) and unflavoured (CTR) oils. I: infusion; M: co-malaxation; X: no aromatization; B: basil; C: chilli; CG: chilli and garlic.
The score plot in Figure 1A allows discovering the relative effects of flavouring methods, storage and different flavouring agents. First, it clearly appears that the basil FOOs had different characteristics from others. In fact, already at T0, B-oils clustered apart from other samples. It was also observed that technology had a stronger effect than frozen storage on characteristics of B-oils. In fact, B-oils from infusion at T3 and T6 clustered together and showed higher positive scores on PC1 linked to oxidative markers (i.e. PV, K232, K270, ox-TAG and polar compounds) as observed in the corresponding loading plot (Figure 1B). On the other hand, C- and CG-oil followed an evolution similar to that of control samples during storage, indicating a less influence of aromatisation on their chemical characteristics. With time, these samples moved progressively from the negative quadrant of the plot to the positive quadrant because of TPC depletion and increase in hydrolytic and oxidative markers (Figure 1B). Changes in quality parameters because of flavouring practices are well known and observed by several authors (Baiano et al., 2009, 2016; Caponio et al., 2016; Clodoveo et al., 2016; Gambacorta et al., 2007; Sacchi et al., 2017; Sousa et al., 2015).
Overall, the results demonstrated that during frozen storage FOOs underwent degradation that caused progressive depletion of phenolic compounds and increase in oxidative and hydrolytic markers. However, a clear interaction emerged between the storage and the kind of flavouring ingredient and flavouring technique.
Aromatisation effect was also observed on the phenolic profile of VOO (Baiano et al., 2016; Caponio et al., 2016; Sacchi et al., 2017). Table 2 shows the significance of differences in the phenolic profile of oils at T3 and T6 with respect to T0, while Figure 2 reports the results of PCA. In all, 13 phenolic compounds were detected belonging to the common classes found in VOOs (Bendini et al., 2007). It is observed in Table 2 that the most important differences in the phenolic profiles of oils at T3 with respect to production was the increase in hydroxytyrosol acetate (3,4-DHPEA-AC, in all samples) and decrease of almost all the other compounds. This trend could be easily noted by looking at PCA results (Figure 2). In spite of some differences linked to spice and flavouring technique, the samples at T3 depicted similar characteristics.
Table 2. Statistical significance, expressed as p-value, of differences in the phenolic profiles of the samples between T3 or T6 and T0.
| 3,4-DHPEA | p-HPEA | Vanillic ac. | Vanillin | Cumaric ac. | 3,4-DHPEA-AC | Ferulic ac. | 3,4-DHPEA-EDA | p-HPEA-AC | p-HPEA-EDA | Pinoresinol | 3,4-DHPEA-EA | p-HPEA-EA | |
|---|---|---|---|---|---|---|---|---|---|---|---|---|---|
| T3 vs. T0 | |||||||||||||
| CTR | 0.01↓ | 0.00↓ | 0.00↑ | 0.83 | 0.17 | 0.01↑ | 0.26 | 0.00↑ | 0.10 | 0.03↑ | 0.03↓ | 0.36 | 0.13 |
| I-B | 0.00↓ | 0.00↓ | 0.23 | 0.06 | 0.11 | 0.00↑ | 0.10 | 0.00↑ | 0.05↓ | 0.00↑ | 0.05↓ | 0.18 | 0.02↓ |
| I-C | 0.53 | 0.79 | 0.51 | 0.54 | 0.02↓ | 0.00↑ | 0.05↓ | 0.02↓ | 0.00↓ | 0.08 | 0.03↓ | 0.00↓ | 0.03↓ |
| I-CG | 0.06 | 0.05↓ | 0.33 | 0.05 | 0.00↓ | 0.03↑ | 0.01↓ | 0.00↓ | 0.00↓ | 0.94 | 0.01↓ | 0.04↓ | 0.00↓ |
| M-B | 0.47 | 0.23 | 0.25 | 0.92 | 0.07 | 0.01↑ | 0.01↓ | 0.00↓ | 0.03↓ | 0.44 | 0.24 | 0.05↓ | 0.00↓ |
| M-C | 0.02↓ | 0.77 | 0.85 | 0.71 | 0.01↓ | 0.02↑ | 0.07 | 0.11 | 0.02↓ | 0.58 | 0.01↓ | 0.01↓ | 0.00↓ |
| M-CG | 0.09 | 0.01↓ | 0.18 | 0.25 | 0.01↓ | 0.01↑ | 0.55 | 0.00↓ | 0.00↓ | 0.01↓ | 0.01↓ | 0.01↓ | 0.01↓ |
| T6 vs. T0 | |||||||||||||
| CTR | 0.00↓ | 0.00↓ | 0.09 | 0.01↑ | 0.73 | 0.01↑ | 0.48 | 0.01↑ | 0.13 | 0.00↑ | 0.07 | 0.18 | 0.08 |
| I-B | 0.00↓ | 0.00↓ | 0.83 | 0.09 | 0.13 | 0.00↑ | 0.96 | 0.00↑ | 0.00↑ | 0.00↑ | 0.01↓ | 0.18 | 0.01↓ |
| I-C | 0.02↓ | 0.04↑ | 0.08 | 0.07 | 0.01↓ | 0.02↑ | 0.04↓ | 0.52 | 0.33 | 0.08 | 0.05 | 0.08 | 0.01↓ |
| I-CG | 0.01↑ | 0.01↑ | 0.01↑ | 0.03↑ | 0.01↓ | 0.01↑ | 0.12 | 0.00↑ | 0.05↓ | 0.00↑ | 0.01↑ | 0.04↑ | 0.02↓ |
| M-B | 0.03↓ | 0.77 | 0.14 | 0.81 | 0.14 | 0.01↑ | 0.24 | 0.30 | 0.00↑ | 0.03↑ | 0.29 | 0.03↑ | 0.01↓ |
| M-C | 0.03↑ | 0.03↑ | 0.01↑ | 0.52 | 0.07 | 0.00↑ | 0.11 | 0.00↑ | 0.26 | 0.01↑ | 0.03↑ | 0.01↑ | 0.82 |
| M-CG | 0.03↓ | 0.00↓ | 0.80 | 0.02↑ | 0.07 | 0.04↑ | 0.68 | 0.00↓ | 0.01↓ | 0.01↓ | 0.52 | 0.36 | 0.05↓ |
CTR: unflavoured oils (control); I: infusion; M: co-malaxation; B: basil; C: chilli; CG: chilli and garlic; 3,4-DHPEA: hydroxytyrosol; p-HPEA: tyrosol; 3,4-DHPEA-AC: hydroxytyrosol acetate; 3,4-DHPEA-EDA: decarboxymethyl oleuropein aglycon; p-HPEA-AC: tyrosol acetate; p-HPEA-EDA: decarboxymethyl ligstroside aglycon; 3,4-DHPEA-EA: oleuropein aglycon; p-HPEA-EA: ligstroside aglycon.
Significant differences (p ≤ 0.05) are highlighted in bold. Up arrows and down arrows indicate respective significant increase and decrease with respect to T0.
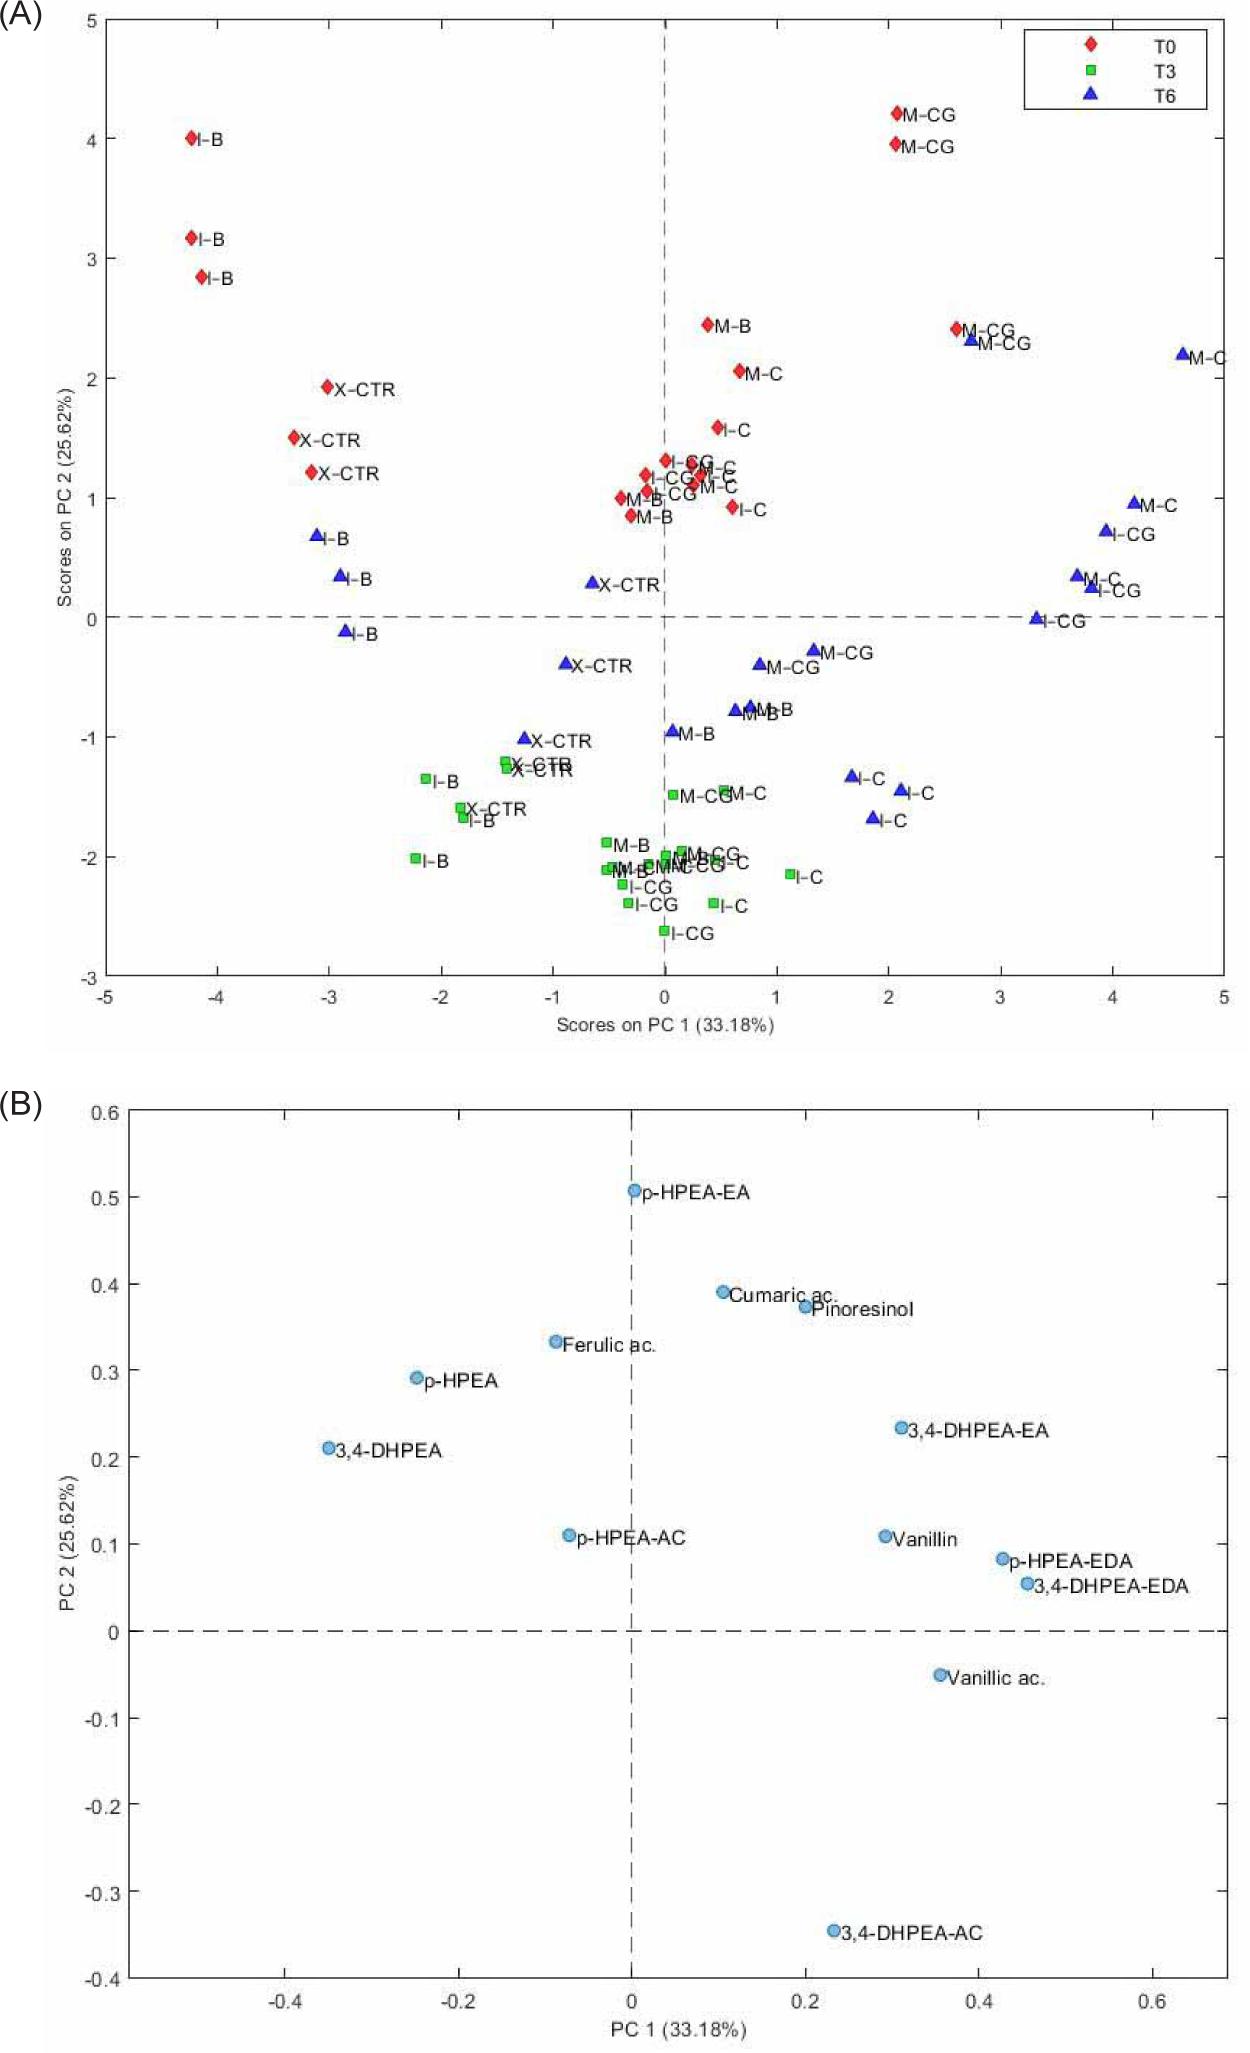
Figure 2. (A) Score plot and (B) loading plot of PCA carried out on the phenolic profile of stored flavoured (B, C and CG) and unflavoured (CTR) oils. I: infusion; M: co-malaxation; X: no aromatization; B: basil; C: chilli; CG: chilli and garlic.
After 6-month storage, all the oils had significant higher values of 3,4-DHPEA-AC. Phenolic alcohols (3,4-DHPEA and p-HPEA) were significantly higher in some cases (I-C, I-CG and M-C) as also secoiridoids such as decarboxymethyl oleuropein aglycon (3,4-DHPEA-EDA), oleocanthal (p-HPEA-EDA) and oleuropein aglycon (3,4-DHPEA-EA) (I-B, I-CG, M-B and M-C). On average, C- and CG-oil had the higher amount of complex secoiridoids at T6. PCA results helped in understanding the interaction of storage, flavouring technique and spice on the phenolic profiles. In B-oils, an important effect of flavouring technique was observed with infusion that brought higher amounts of phenolic alcohols at each time point. On the other hand, in C- and CG-oil, effect of flavouring technique appeared more clearly after 6 months when co-malaxation and infusion affected an increase in 3,4-DHPEA-EDA, p-HPEA-EDA and 3,4-DHPEA-EA.
An increment in simple phenols (such as tyrosol and hydroxytyrosol) was due to progressive hydrolysis from complex secoiridoids (Bendini et al., 2007) and was observed by Mulinacci and co-workers (2013) in extra virgin olive oils (EVOO) stored for 9 months at room temperature. Our findings suggest that this could happen even during frozen storage, although a critical role was played by other factors (kind of spice and flavouring method). The same could be stated for more complex phenols, such as 3,4-DHPEA-EDA and p-HPEA-EDA, that in several cases increased after 6-month storage.
On the other hand, the observed decrements could be explained in different manners. On the one hand, it could be due to the unavoidable oxidation occurring even at low temperatures. On the other hand, as supposed by Cerretani et al. (2005), decrement in phenols after freezing was linked to change in the physical state of oil and the consequent solubilisation of phenols into residual water phase. Mousavi et al. (2021) reported that secoiridoids (mostly 3,4-DHPEA-EDA, 3,4-DHPEA-EA and p-HPEA-EA) decreased during frozen storage, while (p-HPEA-EDA) was the most stable phenol. The findings of the present research are in partial agreement with these. In fact, p-HPEA-EDA was significantly reduced only in the case of M-CG oils, while 3,4-DHPEA-EDA, 3,4-DHPEA-EA and p-HPEA-EA were much more affected by storage in freezing conditions, particularly during the first 3 months (Table 2).
Conclusion
To the best of authors’ knowledge, this is the first research centring the effect of storage under frozen conditions on the quality features of FOOs, together with the possible interaction with flavouring methods and flavouring agents. Low temperatures during storage could slow down degradation, thus safeguarding the quality of FOOs.
During storage, the samples had a significant decrease in total phenolic compounds and an increase in some hydrolytic and oxidative markers. The aromatization by infusion was the worse due to significant increase in the values of FFA, PV, spectrophotometric constants and polar compounds. Also, an interaction with the kind of spice was pointed out. In fact, flavouring with basil by infusion had maximum effect on the quality of the product not only at the time of production but also during storage. On the other hand, chilli and chilli–garlic oils followed an evolution similar to that found in unflavoured samples during storage, indicating a lower influence of aromatisation on oil’s chemical parameters.
Significant changes were also observed in phenolic profiles. Oleuropein- and ligstroside-related compounds decreased during storage whereas oleocanthal was found to be one of the more stable compounds, as also observed in unflavoured EVOOs.
REFERENCES
Akçar H.H. and Gümüşkesen A.S. 2011. Sensory evaluation of flavored extra virgin olive oil. J Food (GIDA). 36(5): 249–253.
Ayadi M.A., Grati-Kamoun, N., and Attia H. 2009. Physico-chemical change and heat stability of extra virgin olive oils flavoured by selected Tunisian aromatic plants. Food Chem Toxicol. 47: 2613. 10.1016/j.fct.2009.07.024
Baiano A., Gambacorta G., and La Notte E. 2010. “Aromatization of Olive Oil.” Transworld Research Network, Kerala, India. ISBN 978-81-7895-462-2.
Baiano A., Previtali M.A., Viggiani I., Varva G., Squeo G., Paradiso V.M., Summo, C., Gomes, T., and Caponio, F. 2016. As oil blending affects physical, chemical, and sensory characteristics of flavoured olive oils. Eur Food Res Technol. 242: 1693. 10.1007/s00217-016-2669-1
Baiano A., Terracone C., Gambacorta G., and La Notte E. 2009. Changes in quality indices, phenolic content and antioxidant activity of flavored olive oils during storage. J Am Oil Chem Soc. 86: 1083. 10.1007/s11746-009-1446-8
Bendini A., Cerretani L., Carrasco-Pancorbo A., Gómez-Caravaca A.M., Segura-Carretero A., Fernández-Gutiérrez A., and Lercker G. 2007. Phenolic molecules in virgin olive oils: a survey of their sensory properties, health effects, antioxidant activity and analytical methods. An overview of the last decade. Molecules. 12: 1679. 10.3390/12081679
Caponio F., Durante V., Varva G., Silletti R., Previtali M.A., Viggiani I., Squeo G., Summo C., Pasqualone A., Gomes T., and Baiano A. 2016. Effect of infusion of spices into the oil vs. combined malaxation of olive paste and spices on quality of naturally flavoured virgin olive oils. Food Chem. 202: 221. 10.1016/j.foodchem.2016.02.005
Caporaso N., Padano A., Nicoletti G., and Sacchi R. 2013. Capsaicinoids, antioxidant activity, and volatile compounds in olive oil flavoured with dried chilli pepper (Capsicum annuum). Eur J Lipid Sci Technol. 115:1434. 10.1002/ejlt.201300158
Cerretani L., Bendini A., Gallina Toschi T., Lercker G., and Biguzzi B. 2005. Freezing storage can affect the oxidative stability of not filtered extra-virgin olive oils. J Commodity Sci. 44: 1000.
Chemat F., Grondin I., Shum Cheong Sing A., and Smadja J. 2004. Deterioration of edible oils during food processing by ultrasound. Ultrason Sonochem. 11: 13. 10.1016/S1350-4177(03)00127-5
Choe E. and Min D.B. 2006. Mechanisms and factors for edible oil oxidation. Compr Rev Food Sci Food Saf. 5: 169. 10.1111/j.1541-4337.2006.00009.x
Clodoveo M.L., Dipalmo T., Crupi P., Durante V., Pesce V., Maiellaro I., Lovece A., Mercurio A., Laghezza A., Corbo F., and Franchini C. 2016. Comparison between different flavored olive oil production techniques: healthy value and process efficiency. Plant Food Hum Nutr. 71: 81. 10.1007/s11130-016-0528-7
Damechki M., Sotiropoulou S., and Tsimidou M. 2001. Antioxidant and pro-oxidant factors in oregano and rosemary gourmet olive oils. Grasas Aceites. 52: 207. 10.3989/gya.2001.v52.i3-4.359
European Commission. 1991. European Community Regulation (EEC) No. 2568/1991. Off J Eur Comm. N. L. 248, Sep. 5, 1991.
Gambacorta G., Faccia M., Pati S., Lamacchia C., Baiano A., and La Notte E. 2007. Changes in the chemical and sensorial profile of extra virgin olive oils flavored with herbs and spices during storage. J Food Lipids. 14: 202. 10.1111/j.1745-4522.2007.00080.x
Hussain A. I., Anwar F., Sherazi S. T. H., and Przybylski R. 2008. Chemical composition, antioxidant and antimicrobial activities of basil (Ocimum basilicum) essential oils depends on seasonal variations. Food Chem. 108: 98. 10.1016/j.foodchem.2007.12.010
Issaoui M., Flamini G., Hajaij M.E., Cioni P.L., and Hammami M. 2011. Oxidative evolution of virgin and flavored olive oils under thermo-oxidation processes. J Am Oil Chem Soc. 88: 1339. 10.1007/s11746-011-1800-5
Li X., Zhu H., Shoemaker C.F., and Wang S.C. 2014. The effect of different cold storage conditions on the compositions of extra virgin olive oil. J Am Oil Chem Soc. 91: 1559. 10.1007/s11746-014-2496-0
Makhlouf F.Z., Squeo G., Difonzo G., Faccia M., Pasqualone A., Summo C., Barkat M., and Caponio F. 2021. Effects of storage on the oxidative stability of acorn oils extracted from three different Quercus species. J Sci Food Agric. 101: 131. 10.1002/jsfa.10623
Mousavi S., Mariotti R., Stanzione V., Pandolfi S., Mastio V., Baldoni L., and Cultrera N.G. 2021. Evolution of extra virgin olive oil quality under different storage conditions. Foods. 10: 1945. 10.3390/foods10081945
Mulinacci N., Ieri F., Ignesti G., Romani A., Michelozzi M., Creti D., Innocenti M., and Calamai L. 2013. The freezing process helps to preserve the quality of extra virgin olive oil over time: a case study up to 18 months. Food Res Int. 54: 2008. 10.1016/j.foodres.2013.03.052
Perestrelo R., Silva C., Silva, P., and Câmara J.S. 2017. Global volatile profile of virgin olive oils flavoured by aromatic/medicinal plants. Food Chem. 227: 111. 10.1016/j.foodchem.2017.01.090
Sacchi R., Della Medaglia D., Paduano A., Caporaso N., and Genovese A. 2017. Characterisation of lemon-flavoured olive oils. Food Sci Technol. (LWT) 79: 326. 10.1016/j.lwt.2017.01.025
Sousa A., Casal S., Malheiro R., Lamas H., Bento A., and Pereira J.A. 2015. Aromatized olive oils: influence of flavouring in quality, composition, stability, antioxidants, and antiradical potential. Food Sci Technol. (LWT) 60: 22. 10.1016/j.lwt.2014.08.026
Veillet S., Tomao V., and Chemat F. 2010. Ultrasound-assisted maceration: an original procedure for direct aromatisation of olive oil with basil. Food Chem. 123: 905. 10.1016/j.foodchem.2010.05.005
Yılmazer M., Karagöz S.G., Ozkan G., and Karacabey E. 2016. Aroma transition from rosemary leaves during aromatization of olive oil. J Food Drug Anal. 24: 299. 10.1016/j.jfda.2015.11.002
Zago L., Squeo G., Bertoncini E.I., Difonzo G., and Caponio F. 2019. Chemical and sensory characterization of Brazilian virgin olive oils. Food Res Int. 126: 108588. 10.1016/j.foodres.2019.108588