
Download

Spread factor = D × F × 10 T 3 Volume cm 3 = d 2 π T 4 4 Density g / c m 2 = w g v c m 3 5
ORIGINAL ARTICLE
Chemical composition, physical properties, and sensory evaluation of wheat-based cookies enriched with different proportions of corn silk
Saeed A. Asiri1, Amal Matar1,2, Ahmed Mahmoud Ismail3*
1Food and Nutrition Sciences Department, College of Agricultural and Food Sciences, King Faisal University, Al-Ahsa, Saudi Arabia;
2Food Science and Technology Department, Faculty of Agriculture, Al-Azhar University, Cairo, Egypt;
3Department of Arid Land Agriculture, College of Agricultural and Food Sciences, King Faisal University, Al-Ahsa, Saudi Arabia
Abstract
Incorporating dried corn silk powder (CSP) into food products is considered beneficial for health and suitable for individuals of all ages. Thus, our study is designed to evaluate the effects of adding CSP to prepared cookies as a nontraditional source of dietary fiber and natural antioxidants, focusing on the chemical composition, physical properties, color attributes, antioxidant activity, and sensory properties of fortified cookies. Different CSP proportions (5%, 10%, 15%, and 20%) replaced wheat flour (WF) with a 72% extraction rate. The results revealed that CSP had significant levels of total phenolic content (TPC) and flavonoid content (TFC), measuring 86.42 mg GAE/g and 112.68 mg QE/g, respectively. CSP contained higher quantities of protein and fiber than WF, with values of 14.81 g and 15.21 g per 100 g of flour weight basis, respectively. The amounts of phenolic compounds in cookie samples increased proportionally with the increasing substitution of CSP, while total carbohydrates decreased. Adding CSP at concentrations of 5%, 10%, 15%, and 20% resulted in corresponding increases in crude fiber of 0.52, 1.2, 2.04, and 2.7 times compared to the control cookie samples. As the amount of CSP supplementation increased (0–20%), TPC and TFC in the cookies increased to 3.06 and 4.08 mg GAE/g and 0.02 to 1.28 mg QE/g, respectively. Increasing CSP proportions led to a significant decrease in diameter, thickness, spread factor, volume, and density of fortified cookies. Furthermore, the L* value exhibited a substantial decline from 65.48 to 51.12 as the amount of CSP substitution increased from 5% to 20%. The sensory evaluation characteristics of the cookie samples indicated that the sample with 15% CSP had the highest overall acceptability score. Therefore, this study demonstrates that adding 15% CSP can effectively yield functional cookies without compromising their sensory acceptability.
Key words: antioxidant activity, chemical composition, corn silk, cookies, sensory, physical
*Corresponding Author: Ahmed Mahmoud Ismail, Department of Arid Land Agriculture, College of Agricultural and Food Sciences, King Faisal University, Al-Ahsa, Saudi Arabia. Email: [email protected]
Received: 11 June 2024; Accepted: 8 October 2024; Published: 22 October 2024
© 2024 Codon Publications
This is an Open Access article distributed under the terms of the Creative Commons Attribution-NonCommercial-ShareAlike 4.0 International (CC BY-NC-SA 4.0). License (http://creativecommons.org/licenses/by-nc-sa/4.0/)
Introduction
Corn silk (CS), often referred to as corn hair, is a significant byproduct generated during the corn processing industry. It is frequently disposed of as waste in agricultural practices or utilized as animal feed (Aukkanit et al., 2015). CS, a silky and yellow substance, develops on the top of the corn cob, specifically on the stigma of the female flower in the corn plant (Zea mays L.). It is a rich source of essential nutrients such as carbohydrates, minerals, resins, vitamins, proteins, fibers, and mucilage (Ren et al., 2013). CS also contains various bioactive substances, including steroids, volatile oils, and natural antioxidants like flavonoids and polyphenols (Bhuvaneshwari and Sivakami, 2015; Žilić et al., 2016). As the major secondary byproduct obtained from corn processing, CS is commonly harvested at a rate of 123-283 kg/ha. However, it has often been treated as agricultural waste, used in fertilizers, or fed to animals due to the lack of efficient methods for its utilization (Singh et al., 2023). Zhao et al. (2017) indicated that CS represents a valuable reservoir of stable and volatile oils, sitosterol, stigma-sterol (steroids), saponins, alkaloids, and natural antioxidants. The flavonoids in CS exhibit various biological activities, including anti-diabetic, antibacterial, antioxidant, and anti-fatigue effects (Žilić et al., 2016). CS fibers are smooth, ranging from 10 to 20 cm in length, and are typically yellow-brown or pale green in color. They are not known to be toxic (El-Seedy et al., 2022). Following the harvest of corn, many chemical components derived from CS, such as phenolic compounds, sterols, flavonoids, polysaccharides, alkaloids, trace elements, volatile oils, organic acids, and various vitamins, are discarded as waste. This not only squanders valuable resources but also harms the natural environment (Tian et al., 2021). CS is an advantageous herbal remedy that enhances and supports health, containing crucial minerals like magnesium, calcium, sodium, and potassium, along with various bioactive compounds, including vitamins, flavonoids, phenolic compounds, steroids, alkaloids, carbohydrates, and proteins (Amjad et al., 2022).
Due to their diverse flavors, crisp texture, and ease of digestion, cookies are a staple in snack foods. White flour (WF), commonly used in the production of commercially available cookies, lacks the nutritional advantages found in whole wheat flour (Hussain et al., 2006). The term “cookie” originates from the Dutch word “koekje” or “koekie,” which translates to “little cake.” It was introduced to the English language by Dutch settlers in North America. Cookies are made in numerous styles, utilizing a wide range of ingredients such as spices, sugars, butter, chocolate, nuts, peanut butter, and dried fruits. The degree of softness in a cookie can be influenced by the baking duration (Waheed et al., 2010). “Cookie” refers to a baked item that is leavened using chemical agents, also known as a ‘biscuit.’ In European countries, the term “biscuit” is predominantly used, while in the USA, “cookie” is more common. Biscuits play a significant role in the human diet as a baked product, often enjoyed alongside beverages and serving as a common choice for introducing solid foods to infants (Abu-Salem and Abou-Arab, 2011). The components of cookies can interact differently when combined, and the quality of both the dough and the final product can be affected by the nature of the ingredients and the processing parameters.
The nutritional composition of beef and chicken patties can be enhanced through the incorporation of corn silk (CS) (Rosli et al., 2011a,b). Additionally, certain species are used as tea, ground into a powder for food additives, and employed as flavoring agents in various parts of the world (Yeşlada and Ezer, 1989). Incorporating corn silk powder (CSP) into crackers has improved their nutritional quality and satisfied snack cravings (Priyadharshini, 2020). It has been suggested to use CSP as an ingredient to enhance the value of novel products (Wang and Zhao, 2019). Therefore, this investigation focuses on formulating cookies with CSP to improve their nutritional composition while ensuring that their texture and sensory attributes remain unaffected.
Our study aimed to evaluate the impact of adding corn silk powder (CSP) to cookies on the physical properties, chemical composition, and sensory attributes of the substituted cookie samples. Different proportions of CSP—5%, 10%, 15%, and 20%—were used to replace wheat flour (WF) with a 72% extraction rate.
Materials and Methods
Preparation of Corn Silk Powder (CSP)
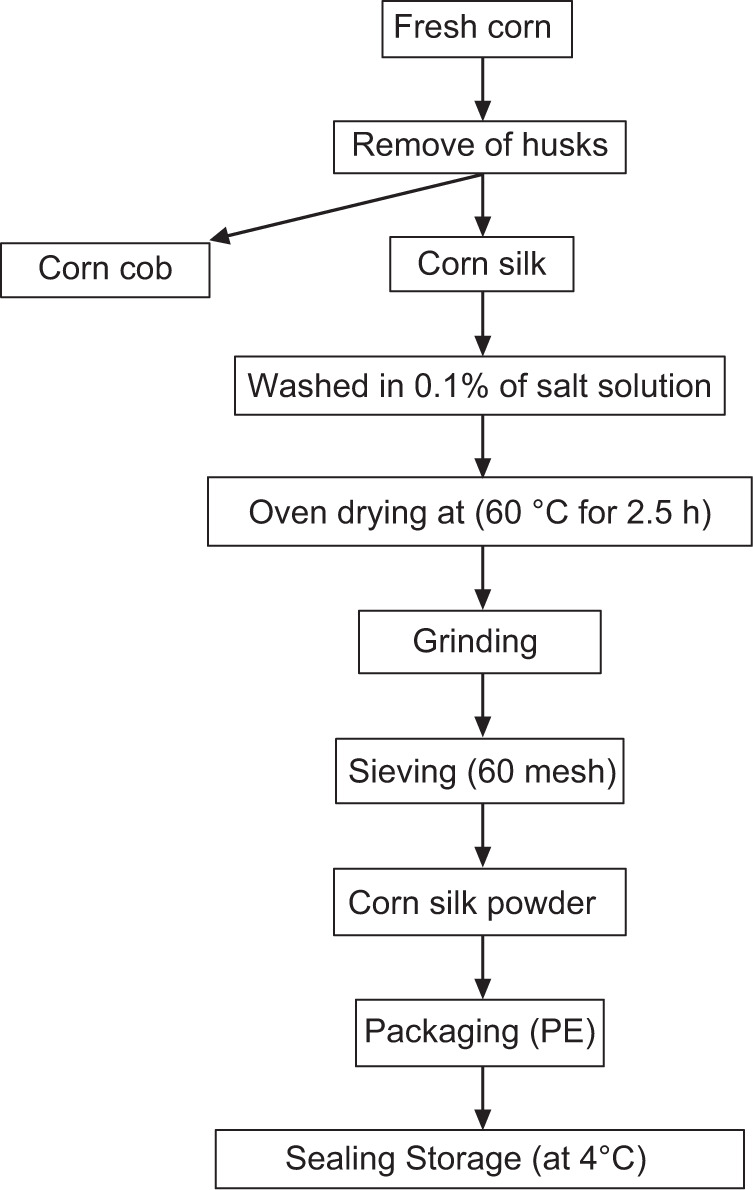
Fresh corn (Zea mays) was collected from a farm located in El-Gharbia Governorate, Egypt. The collection of corn silk (CS) involved a manual process: the corn cob was initially slit with a knife to remove the covering, followed by the individual separation of the cob and CS. The harvested CS was placed in a clean butter paper bag and brought to the lab for further processing. CS underwent thorough washing using a 0.1% salt solution to remove impurities and eliminate the inherent fishy taste associated with corn. After washing, the CS was spread on a clean surface and cut into appropriate sizes after a 10-min interval. On the same day, the washed corn silk was dried in a tray drier for 2.5 h at 60 °C using an air oven (Memmert UE 600, Germany), achieving a moisture content of 7-10%. The dried CS was then manually crushed, ground in an electric grinder (Kenwood model CHP 40, China), and sifted through a 60-mesh sieve to obtain a uniformly sized powder (Rosli et al., 2011b). The corn silk powder (CSP) was stored in a tightly sealed container in the refrigerator at 4 °C. The Main steps of corn silk preparation are illustrated in Figure 1. The cookies were made following the technique outlined by Haslina et al. (2017). Additional ingredients, such as wheat flour (WF) 72%, sugar, dried milk, baking powder, shortening, and eggs, were sourced from local vendors for cookie preparation.
Figure 1. Flow chart for the preparation of corn silk powder.
Recipe and cookies baking
Different batches of WF with a 72% extraction rate and CSP were mixed to produce three different formulations in addition to the control sample. The study utilized varying quantities of a replacement substance of CSP, namely 100:0 % (WF:CSP), 95:5 % (WF:CSP), 90:10 (WF:CSP), and 80:20 (WF:CSP). The cookies were produced with several modifications following the procedure outlined in AACC (2006) and using the ingredients specified in Table 1. After carefully weighing the ingredients, sugar and fat were combined using a Moulinex mixer (LM207128, France) at low speed for 2 min, after which the eggs were added. The creaming process continued until the mixture achieved a foamy texture. The sieved flour, along with baking powder, was mixed with varying amounts of CSP (0, 5, 10, 15, and 20%) for 3 min at moderate speed. Then, the incorporated flour and water were added to the creamed mixture and blended at high speed for 5 min, resulting in a uniform consistency. Following the kneading process, the dough was rolled out to a precise thickness of 9.0 mm. The cookies were shaped using a 50 mm diameter cookie cutter and placed onto a lightly oiled baking pan, ensuring adequate spacing. The cookies were baked at 220 °C in a Craft baking oven (CCB9060FS, Italy) for 10 to 12 min. Once baked, the cookies were cooled to ambient temperature before being stored in airtight polythene bags for subsequent storage studies (Figure 2).
Table 1. Quantities of cookies ingredients.
| Ingredients | Quantity (g) |
|---|---|
| Flour | 200 |
| Shortening | 100 |
| Sugar | 100 |
| Nonfat dry milk | 4.0 |
| Baking powder | 3.0 |
| Salt | 0.18 |
| Egg | 1(in no.) |
| Water | Variable |
Figure 2. Flow chart for the preparation of cookies.
Analytical Method
Chemical composition
Moisture content, crude ether extract, ash, crude protein, and crude fiber of wheat flour (WF), corn silk powder (CSP), and cookies were assessed using AOAC (2010) procedures. Total carbohydrates were estimated using the following formula:
Carbohydrates (%) = 100 – (% moisture+% protein + % ether extract +% ash +% crude fiber) (1)
The calorie value was determined using the Atwater strategy as specified by the Maclean et al. (2003) one of FAO’s primary objectives has been to assure an adequate, nutritionally sound and safe food supply. This has required periodic assessments of the food supply and its comparison with the needs of the population. To enable this, knowledge of human food requirements, both qualitative and quantitative, is required. Thus, one of the earliest and ongoing activities of FAO’s Food and Nutrition Division has been to determine the energy and nutrient requirements of humans. FAO’s first review of energy (“calorie” using the following equation
Calorie value (kcal/100g) = (% carbohydrate × 4.1) + (% protein × 4.1) + (% fat × 9.1). (2)
Determination of minerals
A dried sample (0.5 g) was digested using H2SO4 and H2O. The minerals—magnesium, calcium, sodium, potassium, copper, manganese, iron, phosphorus, and zinc—were assessed using an Atomic Absorption Spectrophotometer (Shimadzu, AA-6650) following the AOAC (2010) method.
Extraction of CSP
To prepare the ethanolic extract of corn silk powder (CSP), 10 g of the powder was mixed with 100 ml of ethanol in a conical flask. The flask was then placed in an orbital shaker (MaxQ 4000, Thermo Fisher Scientific Pvt. Ltd., Mumbai, India) for 72 h. Subsequently, the solution was filtered using Whatman No. 1 filter paper, and the solvent was evaporated using a vacuum oven. The extracted substance was preserved at -20 °C in glass vials. This extract was used to assess both the antioxidant content and its corresponding activity. The reproducibility, accuracy, and precision of the assay procedures were verified by examining the % RSD values presented in the respective tables.
Biochemical analyses
To determine the bioactive compounds, 10 mg of corn silk powder (CSP) was extracted in 10 mL of ethanol, and the clear supernatant was used as the crude extract to analyze the following compounds:
Total phenolic content (TPC)
The Folin–Ciocalteu method was used for the calorimetric estimation of the total phenolic content (TPC) of corn silk powder (CSP) (Rahman and Wan Rosli, 2014). An ethanolic extract (200 µL) was mixed with Folin-Ciocalteu reagent (1.0 mL), followed by the addition of 7.5% sodium carbonate (Na2CO3). The samples were left at room temperature for 30 min, and the absorbance was measured calorimetrically at a wavelength of 765 nm using a UV-Vis spectrophotometer (Shimadzu 1600-UV). The final values were expressed as mg of gallic acid equivalents per 100 g of sample.
Total flavonoid content (TFC)
A mixture of 2 mL of corn silk powder (CSP) extract was combined with 0.2 mL of sodium nitrite (5%), followed by the addition of 0.2 mL of aluminum chloride (10%) and thorough mixing. The resulting solution was then supplemented with 2 mL of 0.1 M NaOH and allowed to stand undisturbed for 6 min. Afterward, the solution was diluted with 0.275 mL of distilled water, and its absorbance was measured calorimetrically at 510 nm using a UV-Vis spectrophotometer (Shimadzu 1600-UV). The total flavonoid content (TFC) was quantified in mg of quercetin equivalents (QE) per 100 g of sample, with quercetin serving as the standard (Sadh et al., 2018).
Tannins
The tannins were quantified following the technique of Price et al. (1987), with some adjustments by Osman (2004), as follows: One gram of corn silk powder (CSP) was combined with 10 mL of a solution containing 1% HCl in methanol. The mixture was then vigorously agitated for 20 min at ambient temperature before filtration. To quantify the tannins in the filtrate, 1 mL of the supernatant was mixed with 5 mL of a vanillin/HCl mixture, prepared by combining equal volumes of methanolic solutions containing 2% vanillin and 8% HCl. The resulting mixture was placed in a test tube and allowed to sit at room temperature for 20 min. The color was measured at 500 nm using a UV-Vis spectrophotometer (Labomed Inc., USA). A standard curve was generated using catechin, and the tannin content was determined as mg of catechin equivalents per 100 grams of dry weight.
Antioxidant Activities
DPPH radical scavenging assay
To create stock solutions with a concentration of 320.0 µg/mL, the corn silk ethanolic extract and quercetin (standard) were separately dissolved in ethanol. Various portions were then taken and diluted to obtain final solutions ranging from 0.1 to 10.0 mg/mL. Each sample was supplemented with 100 µL of DPPH solution, which had a concentration of 0.008% w/v in ethanol, and the total volume was adjusted to 240 µL using ethanol. For the negative control, 100 µL of DPPH was mixed with 140 µL of ethanol. This mixture was used to determine the percentage of inhibition of free radicals. Subsequently, all samples were subjected to a 30-min incubation period at ambient temperature (25 ± 2 ºC) in light-protected conditions. The absorbance (Abs) was measured at 490 nm. The experiment was conducted in triplicate. The capacity to scavenge free radicals was assessed by measuring the free radical scavenging percentage (% I) using the equation provided by Sousa et al. (2007):
% I = (Abscontrol – Abssample/Abscontrol) × 100.
The EC50, the concentration needed to provide a 50% antioxidant effect, was determined using linear regression.
ABTS radical scavenging assay
The free radical scavenging activity of the plant materials was determined using the ABTS radical cation decolorization test. The ABTS+ cation radical was generated by mixing equal volumes of 2.45 mM potassium persulfate and 7 mM ABTS in water, then keeping it in a light-restricted environment at ambient temperature for 12–16 h before use. The ABTS+ solution was diluted with methanol to achieve an absorbance reading of 0.700 at 734 nm. Absorbance measurements were taken 30 min after combining the plant extract (5 µL) with the diluted ABTS+ solution (3.995 mL). Each test was performed at least three times, and a solvent blank was included. The ABTS scavenging effect was calculated using the following formula:
ABTS + scavenging effect (%) = AB − AA/AB × 100.
AB represents the absorbance of ABTS radical + methanol, and AA represents the absorbance of ABTS radical + sample extract/standard. Trolox served as a standard compound, and the measurements were determined in terms of TEAC (Trolox Equivalent Antioxidant Capacity) in mg per gram of dry weight (Rajurkar and Hande, 2011)moisture, ash, crude fiber, fats and waxes. The assays employed were ferric reducing antioxidant power, trolox equivalent antioxidant capacity and scavenging effect on the 1,1-diphenyl-2-picrylhydrazyl free radical. Results obtained indicate that the antioxidant potential varied significantly from plant to plant. The total phenolic contents were determined spectrophotometrically using Folin-Ciocalteu reagent. Significant correlation is observed between ferric reducing antioxidant power and phenolic contents (R2).
Physical analysis of cookies
Measurements of diameter, thickness, volume, and density
The diameter (width), thickness, spread factor, volume, and density of the cookies were evaluated following Kaur et al. (2015). Using a digital Vernier caliper (Mitutoyo 500-506-10: ABSOLUTE Digimatic Caliper 0-24”/600mm, Japan), the average thickness (mm) was determined by stacking six cookies on top of each other, with readings taken in duplicate. For diameter measurements, six cookies were arranged horizontally, and the average width (mm) was computed by repositioning the cookies at a right angle to the previous position. The spread ratio was determined by dividing the diameter by the thickness, using the following formula:
By multiplying the area of the cookie by its thickness, the volume of a cookie can be calculated according to the following equation:
t=average thickness of cookie (mm); d=diameter of cookie (mm).
After calculating volume, the weight was determined with a digital weighing balance, and then density was determined from the weight to volume ratio (AACC, 2000) as following:
Color attributes
A Hunter LAB colorimeter (CM-508 d Model, Minolta, Japan) was used to measure the color of the samples, with triplicate measurements taken for each. The perception of the 3D color space is represented by L*, a*, and b*. The L* value indicates luminance, which reflects brightness on an axis that ranges from complete black to pure white, corresponding to 0% black and 100% white. The a* and b* axes represent the spectrum of colors from redness (+a*) to greenness (-a*) and from yellowness (+b*) to blueness (-b*), respectively. The instrument was calibrated using a white tile of Hunter Lab Color Standard (LX No.16379) with the following values: X = 72.26, Y = 81.94, and Z = 88.14 (L* = 92.46; a* = -0.86; b* = -0.16). Each sample was tested in three different replicates (Spinoso-Castillo et al., 2020).
Sensory evaluation
Sensory evaluation involved a panel of 10 individuals, comprising staff members from the Food Science and Technology Department. Each panelist was assigned samples in a random manner. A 10-point hedonic scale (from 1 = extremely dislike to 10 = extremely like) was used to assess sensory attributes, including taste, color, odor, appearance, texture, and overall acceptability (Gat and Ananthanarayan, 2016).
Statistical analysis
The data were collected in triplicate, and errors were recorded as the standard deviation from the mean (mean ± SD). Data analysis was performed using analysis of variance (ANOVA) in SPSS (IBM version 21.0, USA). Mean values were compared using the Duncan Multiple Range Test (DMRT), and significance was determined at a p-value of < 0.05.
Results and Discussion
Chemical composition of wheat flour (WF) and corn silk powder (CSP)
The findings of the proximal analysis of wheat flour (WF) and corn silk powder (CSP) are illustrated in Table 2. The results show that the carbohydrate content in CSP (54.23%) is higher than that of other nutrients. CSP also contains a significant amount of crude fiber, with a total fiber percentage of 15.21%. The importance of dietary fibers has led to the emergence of a substantial and promising industry for high-fiber products and ingredients. Recently, there has been a growing interest in novel dietary fiber sources for use in the food industry (Chau and Huang, 2003). Furthermore, CSP has an average protein content of 14.81%, an ash content of 4.95%, and a fat level of approximately 0.68%. These findings align with those of Ren et al. (2015), who reported that corn silk is rich in vitamins, proteins, carbohydrates, and minerals, as well as mucilage, resins, and fibers. Additionally, corn silk contains several bioactive compounds, such as volatile oils, steroids, polyphenols, and flavonoids, which serve as natural antioxidants (Bhuvaneshwari and Sivakami, 2015; Qing lan and Zhi hong, 2011; Žilić et al., 2016). In contrast, WF exhibited higher levels of carbohydrates (73.71%) and fat (1.18%), but lower levels of crude fiber (0.58%) and ash (0.74%). Yıldırım and Atasoy (2020) reported similar findings, indicating that the chemical composition of WF included a moisture content of 11.31%, protein of 12.86%, lipids of 1.40%, crude fat of 0.82%, and ash of 0.46%. Moisture content is crucial for the shelf life of food products, making it essential to determine moisture levels when developing enhanced food ingredients. The moisture percentage of CSP was 10.09%, while that of WF was 12.34% (Table 2). The energy estimate for WF was reported as 351.26 kcal/kg, compared to 282.28 kcal/kg for CSP (Table 2). According to Spinoso-Castillo et al. (2020), the incorporation of dried CSP in beef patties reduced the water activity to 0.288, indicating that CSP holds promise as a viable option for developing exceptionally stable value-added products.
Table 2. Proximate analysis of wheat flour (WF) and corn silk powder (CSP).
| Constituents (%) | WF (g/100 g FWB) | CSP (g/100 g FWB) |
|---|---|---|
| Moisture | 12.34 ± 0.546 | 10.09 ± 0.209 |
| Protein | 11.45 ± 0.478 | 14.81 ± 0.301 |
| Fat | 1.18 ± 0.330 | 0.68 ± 0.137 |
| Ash | 0.74 ± 0.111 | 4.98 ± 0.608 |
| Fiber | 0.58 ± 0.062 | 15.21 ± 0.473 |
| Carbohydrates | 73.71 ± 0.633 | 54.23 ± 0.507 |
| Energy (kcal/kg) | 351.26 ± 0.526 | 282.28 ± 0.636 |
Values within columns are the mean ± standard deviation of three replicates.
Mineral contents of CSP
The mineral composition of corn silk powder (CSP), including sodium (Na), phosphorus (P), potassium (K), copper (Cu), calcium (Ca), manganese (Mn), magnesium (Mg), iron (Fe), and zinc (Zn), is presented in Table 3. Corn silk is generally rich in Na, Ca, P, Mg, and K, making it a valuable source of these minerals. The concentrations of Na and Ca were significantly higher, measuring 2316.1 ppm and 1962.45 ppm, respectively. This was followed by Mg and K, which recorded concentrations of 1793.23 ppm and 1268.8 ppm, respectively. CSP also contains notable amounts of trace metals, including Cu (10.06 ppm), Fe (20.16 ppm), Mn (23.89 ppm), and Zn (59.82 ppm) (Table 3). Our findings align with those of Kaur et al. (2023), who documented elevated levels of Na (3654.21 µg/g), Ca (1338.13 µg/g), and Mg (1169.05 µg/g) in dried corn silk. This is consistent with Rahman and Rosli’s (2014) study, which identified the highest levels of macrominerals, such as Na (0.561 ± 0.001 mg/kg), Ca (1.123 ± 0.001 mg/kg), K (0.690 ± 0.001 mg/kg), and Mg (0.209 ± 0.001 mg/kg) in a blanched corn silk beverage. The significant quantities of K and Ca in this beverage are essential for serum lipid control, maintaining bone health, regulating blood pressure, and preventing obesity (Antoine et al., 2012). However, the mineral composition of corn silk can vary due to multiple factors, including atmospheric conditions, irrigation practices, soil characteristics, and the use of organic and inorganic fertilizers (Singh et al., 2022).
Table 3. Mineral composition of corn silk powder (CSP).
| Element | Concentration (ppm) |
|---|---|
| Sodium (Na) | 2316.10 ± 0.436 |
| Calcium (Ca) | 1962.45 ± 0.115 |
| Magnesium (Mg) | 1793.23 ± 0.330 |
| Potassium (K) | 1268.80 ± 0.646 |
| Phosphorous (P) | 1034.76 ± 1.051 |
| Copper (Cu) | 10.06 ± 0.095 |
| Iron (Fe) | 20.16 ± 0.147 |
| Manganese (Mn) | 23.89 ± 0.851 |
| Zinc (Zn) | 59.82 ± 0.910 |
Values within columns are the mean ± standard deviation of three replicates.
Total phenolic content (TPC), total flavonoid content (TFC), and tannins
As indicated in Table 4, corn silk powder (CSP) has a total phenolic content (TPC) of 86.42 mg GAE/g. The total flavonoid content (TFC) in CSP varies among different varieties, ranging from less than 0.1% to 3% (Ho et al., 2016). The current findings show that CSP has a significant TFC of 112.78 mg QE/g. These results align with research conducted by Sarepoua et al. (2015), which demonstrated a notable increase in the concentration of TFC and TPC within corn silk during the silking stage, with recorded concentrations of 6478.3 mg CE/100 g and 10160.8 mg GAE/100 g, respectively. The data presented in Table 4 also highlights the overall antioxidant activity of CSP. The DPPH value was measured at 82.35%, while the ABTS activity for CSP was 76.84%. These findings support previous research, confirming that flavonoid and phenolic contents are reliable indicators of the antioxidant activity of corn silk (Rosli and Suhaiminudin, 2020; Singh et al., 2022). Polyphenolic compounds, tannins, and flavonoids are among the antioxidants found in corn silk, contributing exceptional nutritional value and providing crucial benefits for human health, including antiviral, anti-diabetic, anti-inflammatory, and antioxidant properties (Matkowski et al., 2008).
Table 4. Phytochemical compounds and antioxidant profile of CSP.
| Parameter | Mean + SD |
|---|---|
| Total Phenols (mg GAE/g) | 86.42 ±0.427 |
| Total flavonoids (mg QE/g) | 112.78 ±0.64 |
| Tannins % | 2.01 ±0.225 |
| DPPH % | 82.35 ±0.528 |
| ABTS % | 76.84 ±0.765 |
Values within columns are the mean ± standard deviation of three replicates.
Nutritional composition of CSP-incorporated cookies
The chemical composition of cookies made with varying amounts of corn silk powder (CSP) as a replacement for wheat flour (WF) is presented in Table 5. As the level of CSP increases, the data indicates a corresponding rise in the cookies’ moisture content. This increase can be attributed to the higher fiber content in CSP compared to refined WF, which enhances water absorption capacity. Similarly, Priyadharshini and Parameshwari (2020) reported that the addition of CSP in crackers resulted in an increase in moisture content, reaching 5.67%, surpassing the control crackers, which had a moisture content of 2.07%. In the cookies, moisture content ranged from 4.80% in the control cookie to 5.89% in the (80:20) cookie formulation. In contrast, Ng and Wan Rosli (2013) demonstrated that yeast bread supplemented with 6% CSP exhibited a significantly lower moisture content of 22.58% compared to other samples (p < 0.05).
Table 5. Nutritional composition of CSP-incorporated cookies.
| Composition | WF: CSP (mean + SD) | ||||
|---|---|---|---|---|---|
| 100:0 | 95:5 | 90:10 | 85:15 | 80:20 | |
| Moisture (%) | 4.80d ±0.367 | 4.96c ± 0.135 | 5.11c ±0.238 | 5.46b ±0.087 | 5.89a ±0.491 |
| Protein (%) | 6.56a ±0.425 | 6.60a ±0.170 | 6.62a±0.326 | 6.62a ±0.226 | 6.64a ±0.209 |
| Fat (%) | 26.1a ±0.652 | 26.0a ±0.348 | 25.90a ±0.204 | 25.63b ±0.170 | 25.54c ±0.331 |
| Crude fiber (%) | 0.21e ±0.036 | 0.32d ±0.360 | 0.47c±0.052 | 0.64b ±0.045 | 0.79a ±0.111 |
| Ash (%) | 0.41d ±0.078 | 0.49c ±0.608 | 0.55b ±0.070 | 0.62a ±0.043 | 0.68a ±0.121 |
| Carbohydrate (%) | 61.92a ± 0.434 | 61.63a ±0.286 | 61.35b ±0.410 | 61.03c ±0.167 | 60.46d ±0.403 |
| Calorie (kcal/100g) | 508.82a ±0.495 | 506.92a ±0.532 | 504.98b ±0.438 | 501.27c ±0.625 | 498.26d ±0.115 |
| Total Phenols (mg GAE/g) | 3.06e ±0.168 | 3.28d ±0.141 | 3.56c ±0.226 | 3.88b ±0.907 | 4.08a ±0.079 |
| Total flavonoids (mg QE/g) | 0.02e ±0.005 | 0.74d ±0.043 | 0.82c ±0.112 | 0.96b ±0.062 | 1.28a ±0.278 |
| Na (ppm) | 320.05d ±0.257 | 328.54c ±0.316 | 331.08b ±0.081 | 340.21a ±0.079 | 349.32a ±0.255 |
| Ca (ppm) | 548.91d ±0.773 | 571.12c ±0.255 | 579.22b ±0.270 | 580.78a ±0.392 | 581.08a ±0.111 |
| Fe (ppm) | 10.23c ±0.442 | 10.38b ±0.499 | 10.41b ±0.303 | 10.50a ±0.292 | 10.56a ±0.310 |
| Zn (ppm) | 16.48d ±0.374 | 16.63c ±0.112 | 16.69b ±0.245 | 16.72b ±0.088 | 16.92a ±0.061 |
Values within columns are the mean ± standard deviation of three replicates. Values within the same row that are denoted by distinct letters are significantly dissimilar (LSD) at p<0.05.
No substantial variations in protein content were observed across the different treatments. However, significant changes in fat content were detected, with the fat content ranging from 26.1% in the control cookie to 25.54% in the (80:20) cookie. This difference may be attributed to the lower fat content in CSP. The replacement of WF with various ratios of CSP (5%, 10%, 15%, and 20%) promoted enhancements in both ash content and total crude fiber in the fortified cookies. Ash content increased with higher levels of CSP, rising from 0.41% in the control cookie to 0.68% in the (80:20) cookie. Aukkanit et al. (2015) noted that incorporating up to 4% CSP in meatballs resulted in increased levels of ash and crude fiber. A significant rise in crude fiber content was also observed, increasing from 0.21% in the control cookie to 0.79% in the (80:20) cookie. The various CSP ratios led to notable enhancements in crude fiber content, with increases of approximately 0.52, 1.24, 2.05, and 2.76 times compared to the control (Table 5). Furthermore, all phytochemical properties, including total phenolic content (TPC) and total flavonoid content (TFC), were elevated in CSP-incorporated cookies. As the amount of CSP supplementation increased from 0% to 20%, TPC increased from 3.06 to 4.08 mg GAE/g, while TFC rose from 0.02 to 1.28 mg QE/g. These results reflect the high content of TPC and TFC in CSP, as reported by Ho et al. (2016) and Sarepoua et al. (2015).
Data in Table 5 illustrate that the replacement of WF with different ratio of CSP (5, 10, 15, and 20%) promoted enhancements in all mineral contents of the fortified cookie. Calcium was the predominant elements and recorded at 548.91 ppm in the control and increasing to 581.08 ppm in the (80:20) cookie followed by Na, which recorded 320.05 ppm in control cookie and reached to 349.32 ppm in (80:20) cookie. The mineral content in CSP-incorporated cookies may vary due to several factors, including differences in plant nutrition, maize cultivar, soil, and climatic conditions (Hamurcu et al., 2010).
Physical characteristics of CSP-incorporated cookies
Table 6 demonstrates a notable reduction in the diameter of cookies as the amount of CSP increased. The control sample exhibited the largest diameter at 48 mm, followed by the 5% CSP sample with a diameter of 47.5 mm. In contrast, the 15% and 20% CSP samples had the smallest diameter, measuring 46 mm. This decrease in width can be attributed to the high dietary fiber content in CSP, which enhances water retention, as noted by Singh (2008). Additionally, cookies made with lipid-free flours, such as those incorporating CSP, typically have reduced diameters compared to those made with unprocessed flours. As highlighted by Pareyt and Delcour (2008), the decrease in cookie diameter correlates with the increasing proportion of CSP, which has a lower fat content (0.68%) compared to soft wheat flour (approximately 1.18%). The thickness of the cookies also exhibited a notable reduction, decreasing from 9.80 mm in the control and 5% CSP samples to 9.53 mm in the 15% and 20% CSP samples. This trend indicates that higher levels of CSP significantly contribute to a reduction in cookie thickness, reinforcing the relationship between CSP incorporation and changes in physical attributes of the cookies.
Table 6. Physical characteristics of CSP-incorporated cookies.
| Physical parameters | WF: CSP (mean + SD) | ||||
|---|---|---|---|---|---|
| 100:0 | 95:5 | 90:10 | 85:15 | 80:20 | |
| Diameter (mm) | 48.00a ± 1.01 | 47.50b ±0.449 | 47.00c ±0.933 | 46.0d ±0.894 | 46.00d ±0.825 |
| Thickness (mm) | 9.80a ± 0.789 | 9.76a ±0.726 | 9.60b ±0.173 | 9.53c ±0.258 | 9.53c ±0.105 |
| Spread factor | 48.97a ±0.0755 | 48.96a ±0.072 | 48.95a ±0.062 | 48.26b ±0.053 | 48.37c ±0.087 |
| Volume (cm3) | 14.43a ±0.070 | 13.82b ±0.096 | 13.11c ±0.026 | 12.42d ±0.034 | 12.41d ±0.045 |
| Density (g/cm3) | 0.81c ±0.090 | 0.85b±0.036 | 0.89b ±0.035 | 0.94a ±0.051 | 0.94a ±0.052 |
Values within columns are the mean ± standard deviation of three replicates. Values within the same row that are denoted by distinct letters are significantly dissimilar (LSD) at p<0.05.
The analysis of the cookie spread factor revealed a decrease from 48.97 mm in the control sample to 48.26 mm when 15% CSP was incorporated (Table 6). This trend suggests that increasing the amount of CSP significantly impacts the spread factor of the cookies, consistent with findings by Hussain et al. (2006), who noted a reduction in spread factor from 48.49 mm to 47.71 mm with the addition of 30% flaxseed flour. Additionally, Vieira et al. (2008) highlighted the strong relationship between a cookie’s spread and the water absorption capacity of the flour used. As the fiber content from CSP increased, the volume of the cookies decreased, while the density increased. The density values ranged from 0.81 g/cm3 for the control sample to 0.94 g/cm3 for the cookies with 20% CSP. This increase in density can be attributed to the higher fiber content in CSP, which affects the overall structure and moisture retention of the cookies.
Color attributes of CSP-incorporated cookies
The color attributes of bakery products, especially lightness, play a crucial role in consumer acceptability (Angioloni and Collar, 2011). The fortified cookie samples exhibited significant color variations compared to the control sample made with 100% WF. As shown in Table 7, the Hunter color values for lightness (L*), redness (a*), and yellowness (b*) were markedly affected by the incorporation of CSP. The L* value decreased substantially from 65.48 to 51.12 as the substitution of CSP increased from 5% to 20%. This decline in lightness aligns with findings by Sudha et al. (2007), who noted that the addition of bran results in darker surface colors. Conversely, the a* value, indicating redness, increased with higher CSP levels: from 8.10 in the control cookie to 9.94 in the cookie with 20% CSP. This trend suggests that CSP enhances the reddish hue of the cookies. Furthermore, the b* value, which reflects yellowness, rose from 16.82 to 19.10 with increasing amounts of CSP. These findings can be attributed to the higher concentration of yellow and red pigments in corn silk compared to wheat (Rozan et al., 2022). The yellowness values (b*) of the flour blends were significantly elevated (p < 0.05) when CSP was added, with the highest value of 11.85 observed at 20% CSP substitution. This increased yellowness may be linked to the elevated carotenoid pigments present in CS (Laeliocattleya et al., 2014).
Table 7. Color attributes of CSP-incorporated cookies.
| Color attributes | WF: CSP (mean + SD) | ||||
|---|---|---|---|---|---|
| 100:0 | 95:5 | 90:10 | 85:15 | 80:20 | |
| L* | 65.48a ±0.815 | 63.65b ±0.815 | 60.22c ±0.864 | 58.42d ±0.460 | 51.12e ±0.923 |
| a* | 8.10e ±0.115 | 8.89d ±0.366 | 9.13c ±0.180 | 9.42b ±0.531 | 9.94a ±0.156 |
| b* | 16.82e ±0.811 | 17.22d ±0.720 | 17.82c ±0.151 | 18.34b ±0.645 | 19.10a ±0.185 |
Values within columns are expressed as the mean ± standard deviation of three replicates. Within the same row, values denoted by distinct letters indicate significantly dissimilar (LSD) at p<0.05.
Sensory evaluation of CSP-incorporated cookies
The sensory evaluation data in Table 8 shows that fortified cookies with 5%, 10%, 15%, and 20% CSP significantly differed from the control sample across various sensory attributes. Specifically, replacing WF with CSP in these amounts led to a noticeable decline in overall cookie quality scores. The appearance of cookies with different CSP proportions varied significantly compared to the control, although the cookies fortified with 5% CSP exhibited no significant differences. Significant effects on cookie color were observed at 15% and 20% CSP levels compared to the control, while no significant differences were noted between the 5% and 10% CSP cookies relative to the control. Statistical analysis revealed significant changes (p < 0.05) in odor and taste, with scores decreasing as CSP levels increased. The odor score, for instance, dropped to 6.80, 7.86, and 7.66 for samples containing 15%, 10%, and 20% CSP, respectively. The texture score also fell significantly from 8.72 in the control sample to 7.11, 7.32, 7.74, and 7.62 for cookies with 5%, 10%, 15%, and 20% CSP. These findings align with previous research by Bhuvaneshwari and Sivakami (2015), which indicated that cakes containing 15% CS had significantly reduced sensory quality compared to the control but remained within an acceptable range. The data indicate that cookies fortified with 10% and 15% CSP had the highest acceptability scores, with the best overall acceptability observed in the (85:15) cookie formulation. Generally, the maximum CSP amount for satisfactory cookies appears to be 15%, consistent with prior studies showing insignificant differences in organoleptic assessments between control and fiber-fortified products (El-Hadidi, 2006; Saeed, 2010; Sharoba et al., 2013).
Table 8. Sensory evaluation scores of CSP-incorporated cookies.
| Parameters | WF: CSP (mean + SD) | ||||
|---|---|---|---|---|---|
| 100:0 | 95:5 | 90:10 | 85:15 | 80:20 | |
| Appearance | 9.12a ± 0.251 | 9.00a ±0.790 | 8.87b ±0.874 | 8.71c ±0.295 | 8.62d ±0.554 |
| Color | 8.90a ± 0.940 | 7.76b ±0.840 | 8.74b ±0.278 | 8.60c ±0.705 | 8.35d ±0.325 |
| Odor | 9.22a ± 1.04 | 8.84b ±0.217 | 8.65c ±0.776 | 8.36d ±0.480 | 6.80e ±0.132 |
| Taste | 9.10a ± 0.905 | 8.65b ±0.776 | 8.24c ±0.459 | 8.12d ±0.329 | 6.16e ±0.168 |
| Texture | 8.72a ± 0.446 | 7.11d ±0.170 | 7.32c ±0.335 | 7.74b ±0.271 | 7.62b ±0.471 |
| Overall acceptability | 9.01a ± 0.060 | 8.27c ±0.343 | 8.36b ±0.480 | 8.38b ±0.389 | 7.51d ±0.595 |
Values within columns are the mean ± standard deviation of three replicates. Values within the same row that are denoted by distinct letters are significantly dissimilar (LSD) at p<0.05.
Heatmap and hierarchical clustering
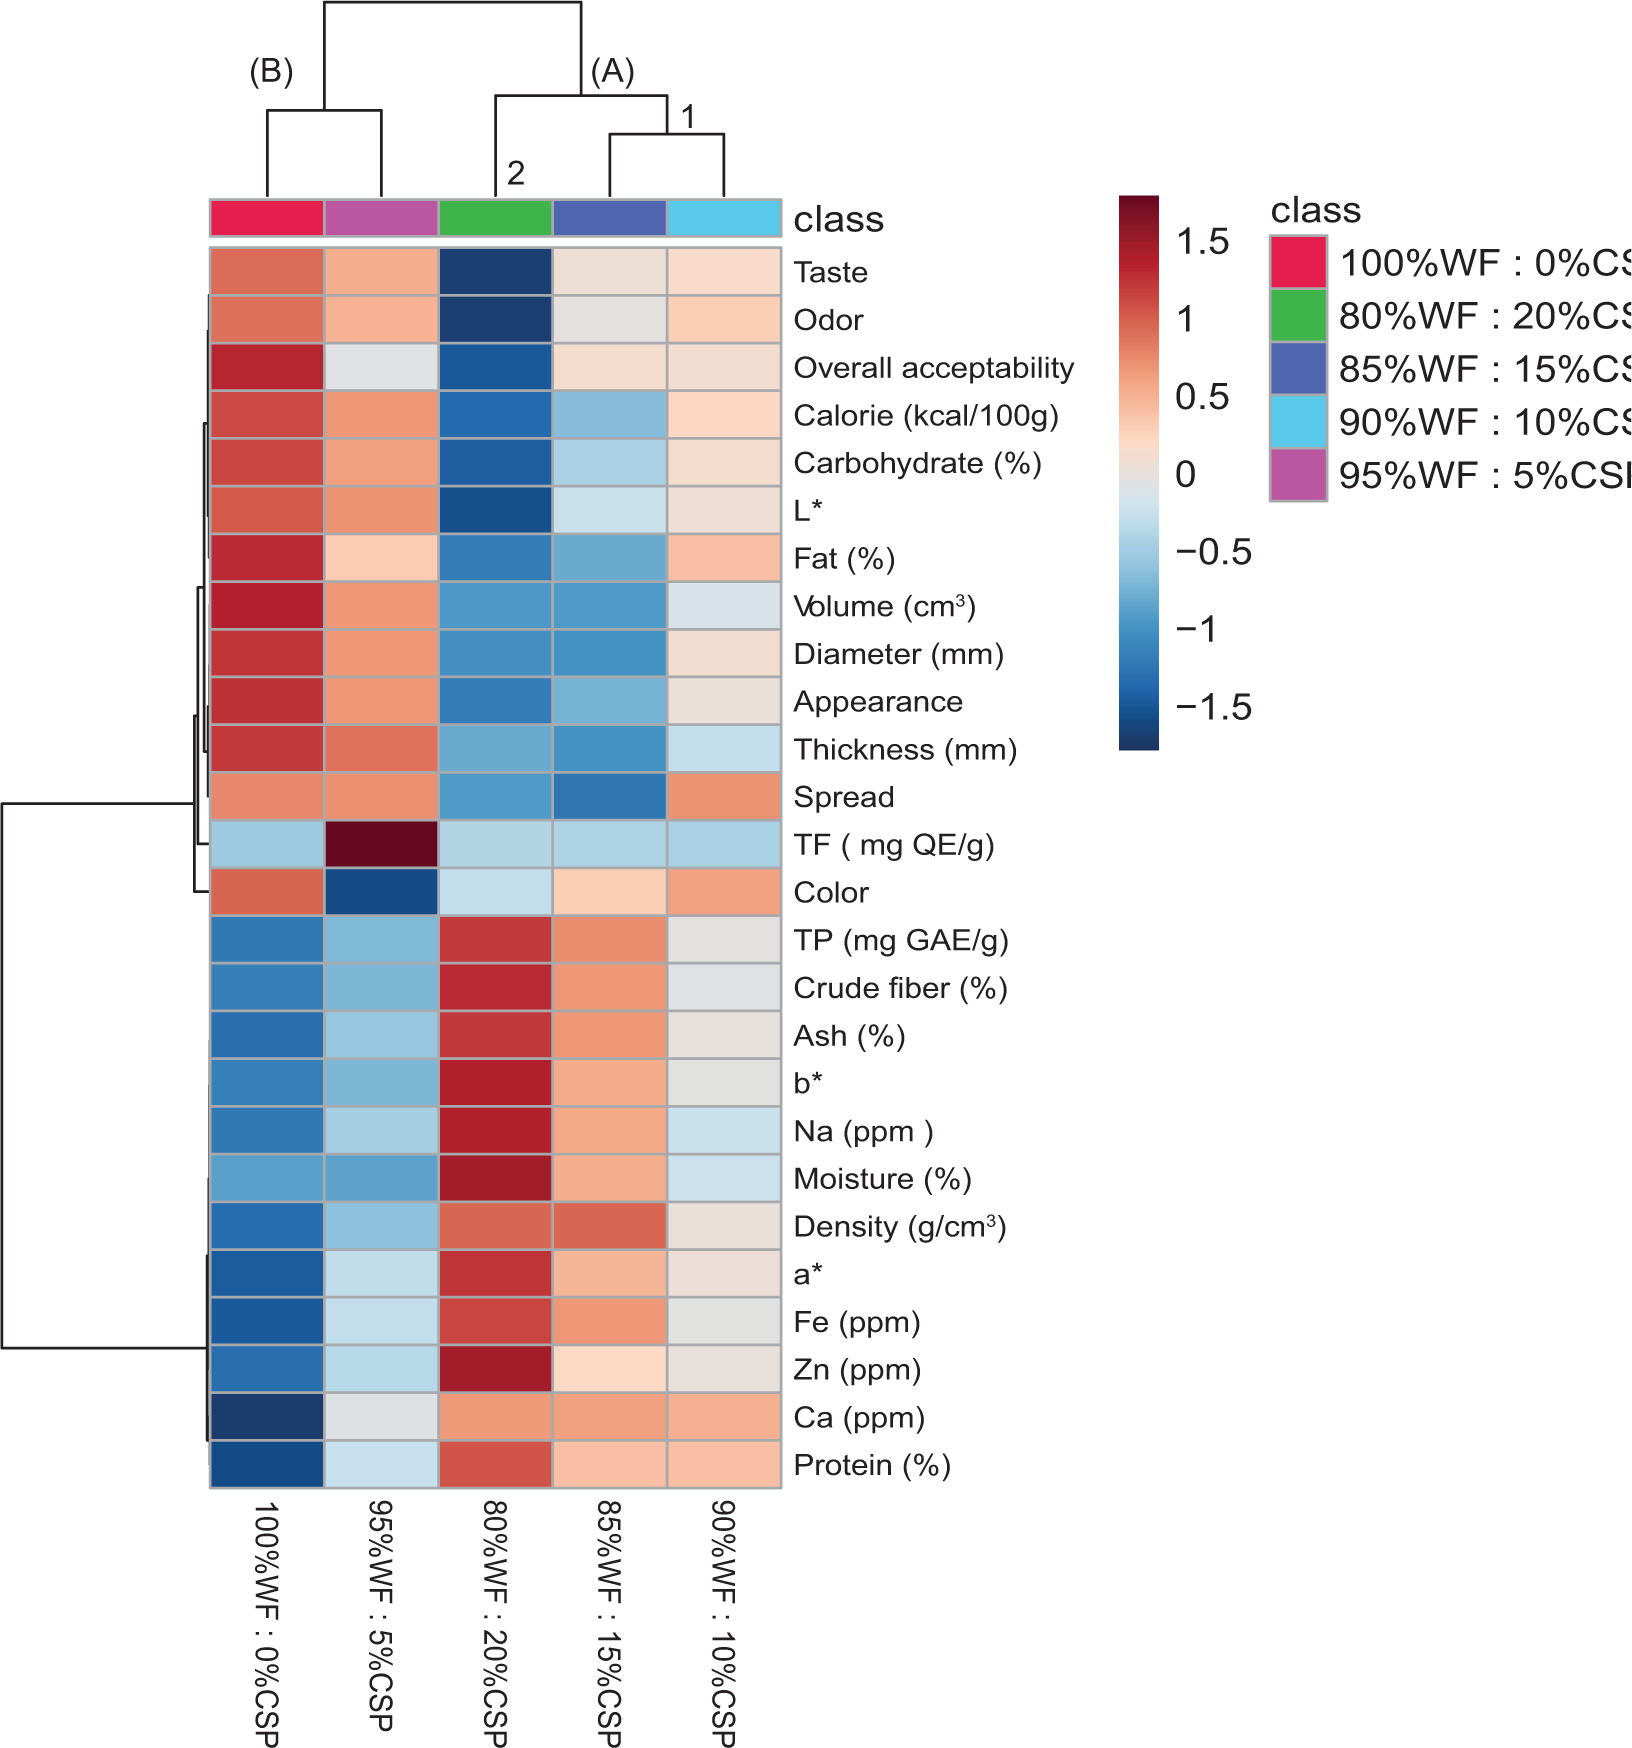
Heatmap hierarchical clustering was conducted to explore the relationships between different CSP proportions and WF-based cookies based on various tested parameters (Figure 3). The parameters for CSP-incorporated cookies were plotted on the Y-axis, while the WF ratios were displayed on the X-axis. The analysis revealed two major clusters (A and B), with cluster A further divided into two sub-clusters labeled 1 and 2 (Figure 3). The heatmap clustering results highlighted a clear distinction among cookies fortified with different CSP levels compared to the WF-based cookies. Notably, cookies containing 15% CSP emerged with the highest acceptability score, suggesting that this proportion maximizes sensory appeal. Furthermore, the heatmap indicated that the incorporation of CSP significantly impacted the spread factor of the cookies, reflecting the effects of substituting varying amounts of WF with CSP. Overall, the data reinforced that cookies fortified with 15% CSP yielded the best overall acceptability, making it the optimal level for satisfactory cookie production.
Figure 3. Heatmap hierarchical cluster analysis based on measured parameters of fortified cookies. Parameters of CSP-incorporated cookies were placed on the Y-axis, whereas the WF: CSP proportions were placed on X-axis. Colors indicate high (red) and low (blue) associations between different proportions of WF: CSP and investigated parameters.
Multivariate analysis of the phenotypic and biochemical parameters
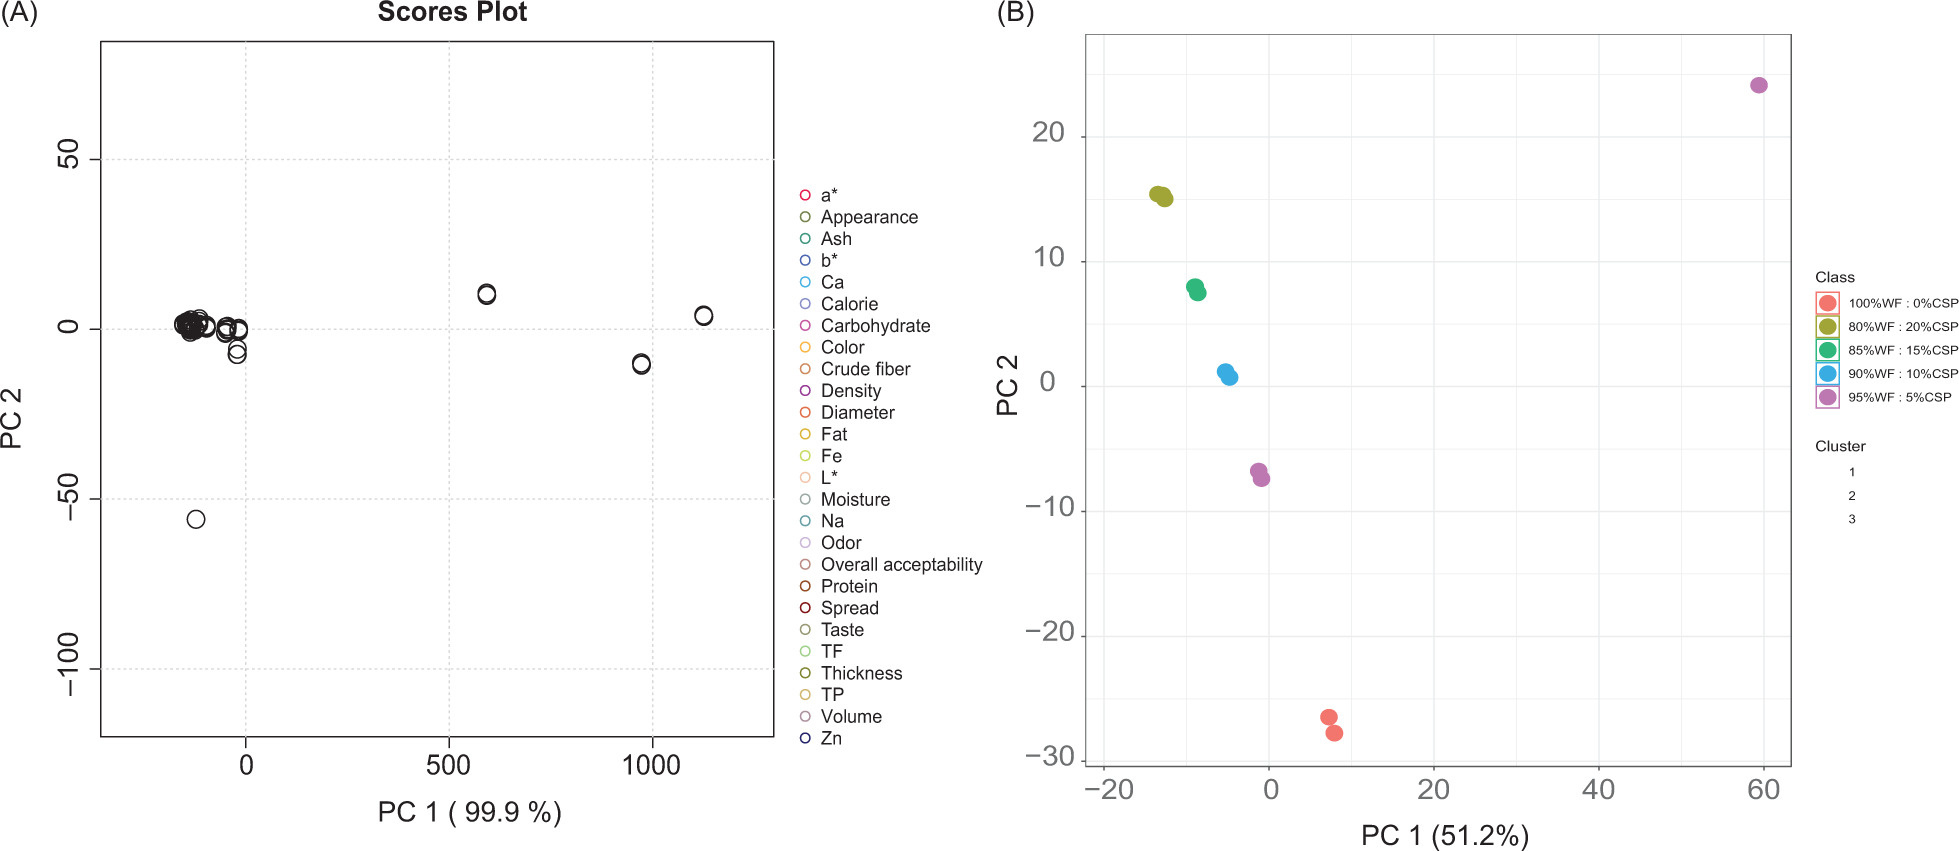
To enhance our understanding of the correlation between different proportions of WF:CSP and the measured parameters, a Principal Component Analysis (PCA) was performed (Figure 4). This analysis aligns with the findings from the heatmap and hierarchical clustering in Figure 3. The first principal component (PC1) accounted for an impressive 99.9% of the observed variability among the different WF ratios and the cookie parameters, while the second principal component (PC2) showed no variability (0.0%). Additionally, K-means clustering was conducted to further validate the relationships between the different WF: CSP proportions based on the assessed parameters (Figure 4). This clustering identified three major clusters, illustrating distinct groupings among the various cookie formulations. Overall, the PCA and K-means clustering reinforce the findings from the heatmap analysis, underscoring the significant influence of CSP incorporation on cookie characteristics.
Figure 4. PCA score plot for the measured parameters of fortified cookies and K-means clustering of investigated proportions of WF:CSP.
Conclusions
In summary, maize silk presents significant potential as a valuable source of antioxidants and essential nutrients. CSP is an excellent natural option for increasing dietary fiber and antioxidant content, rich in polyphenols and flavonoids. Incorporating CSP into cookies not only boosts their nutritional profile—enhancing protein, fiber, vitamin C, calcium, and magnesium content—but also maintains sensory appeal, with 10% CSP being particularly well-received by consumers. This integration may help reduce formulation costs while preserving desirable product qualities. Future research should explore the additional health benefits of maize silk, particularly its potential as a prebiotic, to further enhance its applicability in food products.
Funding
This work was funded by the Deanship of Scientific Research, Vice Presidency for Graduate Studies and Scientific Research, King Faisal University, Saudi Arabia, grant number (KFU241013).
Acknowledgments
The authors extend their gratefulness to the Deanship of Scientific Research, Vice Presidency for Graduate Studies and Scientific Research, King Faisal University, Saudi Arabia, for supporting this work for work through grant number KFU241013.
Conflict of Interest
The authors declare no conflict of interest.
Data Availability
The data presented in this study are available on request from the corresponding author.
REFERENCES
AACC. (2000). Approved Methods of the American Association of Cereal Chemists. St. Paul. Minnesota, American Association of Cereal Chemists.
AACC. (2006). Approved Methods of American Association of Cereal Chemists. St. Paul. Minnesota, American Association of Cereal Chemists.
Abu-Salem F. M. & Abou-Arab A. A. (2011). Effect of supplementation of bambara groundnut (Vigna Subterranean L.) flour on the quality of biscuits. African Journal of Food Science, 5, 376–383.
Amjad A., Rizwan B., & Jabeen S. (2022). The effect of methanolic extract of corn silk in gentamicin induced acute renal injury in rats model. Pakistan Biomedical Journal, 5, 308–312. 10.54393/pbmj.v5i1.259
Angioloni A. & Collar C. (2011). Physicochemical and nutritional properties of reduced-caloric density high-fibre breads. LWT–Food Science and Technology, 44, 747–758. 10.1016/j.lwt.2010.09.008
Antoine J.M.R., Hoo Fung L.A., Grant C.N., Dennis H.T., & Lalor G.C. (2012). Dietary intake of minerals and trace elements in rice on the Jamaican market. Journal of Food Composition and Analysis, 26, 111–121. 10.1016/j.jfca.2012.01.003
AOAC. (2010). Official Methods of Analysis. Washington, D.C. United States of America, Association of Official Analytical Chemists.
Aukkanit N., Kemngoen T., & Ponharn N. (2015). Utilization of corn silk in low fat meatballs and its characteristics. Procedia–Social and Behavioral Sciences, 197, 1403–1410. 10.1016/j.sbspro.2015.07.086
Bhuvaneshwari K. & Sivakami S. (2015). Analysis of nutrients and phytochemicals content in corn silk (Zea Mays). International Journal of Scientific Research, 78, 2319–7064.
Chau C.-F. & Huang Y.-L. (2003). Comparison of the chemical composition and physicochemical properties of different fibers prepared from the peel of Citrus Sinensis L. Cv. Liucheng. Journal of Agricultural and Food Chemistry, 51, 2615–2618. 10.1021/jf025919b
El-Hadidi S.T. (2006). Chemical and biological evaluation of cake products containing resistant starch and dietary fiber.
El-Seedy G.M., Sahloul T.M., & Lsmail F.A.K.M.L. (2022). The therapeutic effect of corn silk on rats with kidney stones. Journal of Research in Fields of Specific Education, 8, 863–885.
Gat Y. & Ananthanarayan L. (2016). Use of paprika oily extract as pre-extrusion colouring of rice extrudates: impact of processing and storage on colour stability. Journal of Food Science and Technology, 53, 2887–2894. 10.1007/s13197-016-2271-3
Hamurcu M., Özcan M.M., Dursun N., & Gezgin S. (2010). Mineral and heavy metal levels of some fruits grown at the roadsides. Food Chemistry and Toxicology, 48, 1767–1770. 10.1016/j.fct.2010.03.031
Haslina H., Praseptiangga D., Bintoro V.P., & Pujiasmanto B. (2017). Chemical and phytochemical characteristics of local corn silk powder of three different varieties. International Journal of Advanced Science, Engineering and Information Technology, 7, 1957. 10.18517/ijaseit.7.5.2932
Ho Y.M., Wan Amir Nizam W.A., & Wan Rosli W.I. (2016). Antioxidative activities and polyphenolic content of different varieties of malaysian young corn ear and cornsilk. Sains Malaysiana, 45(2), 195–200.
Hussain S., Anjum F.M., Butt M.S., Khan M.I., & Asghar A. (2006). Physical and sensoric attributes of flaxseed flour supplemented cookies. Turkish Journal of Biology, 30, 87–92.
Kaur M., Sandhu K.S., Arora A., & Sharma A. (2015). Gluten free biscuits prepared from buckwheat flour by incorporation of various gums: physicochemical and sensory properties. LWT–Food Science and Technology, 62, 628–632. 10.1016/j.lwt.2014.02.039
Kaur P., Singh J., Kaur M., Rasane P., Kaur S., Kaur J., Nanda V., Mehta C.M., & Sowdhanya D. (2023). Corn silk as an agricultural waste: a comprehensive review on its nutritional composition and bioactive potential. Waste and Biomass Valorization. 14, 1413–1432. 10.1007/s12649-022-02016-0
Laeliocattleya R.A., Prasiddha I.J., Estiasih T., Maligan J.M., and Muchlisyiyah J., 2014. The Potential of Bioactive Compounds from Corn Silk (Zea Mays L.) That result from gradual fractionation using organic solvents for the use as a natural sunscreen. Jurnal Teknologi Pertanian, 15.
Maclean W., Harnly J., Chen J., Chevassus-Agnes S., Gilani G., Livesey G., & Warwick P. (2003). Food Energy–Methods of Analysis and Conversion Factors. Food and Agriculture Organization of the United Nations Technical Workshop Report. The Food and Agriculture Organization, Rome, Italy, pp. 8–9.
Matkowski A., Tasarz P., & Szypuła E. (2008). Antioxidant Activity of herb extracts from five medicinal plants from lamiaceae, subfamily lamioideae. Journal of Medicinal Plants Research, 2, 321–330.
Ng S.H., & Rosli W.W.L. (2013). Effect of Cornsilk (Maydis Stigma) Addition in yeast bread: investigation on nutritional compositions, textural properties and sensory acceptability. International Food Research Journal, 20, 339.
Ning X., Zheng X., Luo Z., Chen Z., Pan X., Yu K., et al. (2022). Corn silk flour fortification as a dietary fiber supplement: evolution of the impact on paste, dough, and quality of dried noodles. International Journal of Food Engineering, 18, 479–487. 10.1515/ijfe-2021-0360
Osman M.A. (2004). Changes in sorghum enzyme inhibitors, phytic acid, tannins and in vitro protein digestibility occurring during Khamir (Local Bread) fermentation. Food Chemistry, 88, 129–134. 10.1016/j.foodchem.2003.12.038
Pareyt B. & Delcour J.A. (2008). The role of wheat flour constituents, sugar, and fat in low moisture cereal based products: a review on sugar-snap cookies. Critical Reviews in Food Science and Nutrition, 48(8), 824–839. 10.1080/10408390701719223
Price M.L., Van Scoyoc S., & Butler L.G. (1987). A critical evaluation of the vanillin reaction as an assay for tannin in sorghum grain. Journal of Agricultural and Food Chemistry, 26(6), 1214–1218. 10.1021/jf60219a031
Priyadharshini K. (2020). Development of value-added nutritious crackers incorporated with corn silk powder. Bioscience Biotechnology Research Communications, 13, 1416–1420. 10.21786/bbrc/13.3/64
Qing lan H. & Zhi hong D. (2011). Protective effects of flavonoids from corn silk on oxidative stress induced by exhaustive exercise in mice. African Journal of Biotechnology, 10, 3163–3167. 10.5897/AJB10.2671
Rahman N.A. & Wan Rosli W.I. (2014). Nutritional compositions and antioxidative capacity of the silk obtained from immature and mature corn. Journal of King Saud University–Science, 26, 119–127. 10.1016/j.jksus.2013.11.002
Rajurkar N.S. & Hande S.M., (2011). Estimation of phytochemical content and antioxidant activity of some selected traditional indian medicinal plants. Indian Journal of Pharmaceutical Sciences, 73(2), 146–151. 10.4103/0250-474X.91574
Ren S.-C., Qiao Q.-Q., & Ding X.-L. (2013). Antioxidative activity of five flavones glycosides from corn silk (Stigma Maydis). Czech Journal of Food Sciences, 31(2), 148–155. 10.17221/194/2012-CJFS
Ren Z., Wang J., Pan Z., Zhao K., Zhang H., Li Y., Zhao Y., Mora-Sero I., Bisquert J., & Zhong X. (2015). Amorphous TiO2 buffer layer boosts efficiency of quantum dot sensitized solar cells to over 9%. Chem Mater, 27, 8398–8405. 10.1021/acs.chemmater.5b03864
Rosli W., Nurhanan A.R., Solihah M.A., & Mohsin S.S.J. (2011a). Cornsilk improves nutrient, physical traits and unaffected sensory properties of chicken patties. Sains Malaysiana, 40, 1165–1172.
Rosli W., Nurhanan A.R., Solihah M.A., & Mohsin S.S.J. (2011b). Cornsilk improves nutrient content and physical characteristics of beef patties. Sains Malaysiana, 40, 155–161.
Rosli W. & Suhaiminudin N.S. (2020). Mineral composition, heavy metal and sensory acceptability of drink developed from cornsik (Zea Mays Hairs). Advances in Natural and Applied Sciences, 14(1), 14–19.
Rozan M., El-Shshtawy T., & Boriy E. (2022). Nutritional value, antioxidant activity, cooking quality, and sensory attributes of pasta enriched with cornsilk. Egyptian Journal of Food Science, 50, 283–297. 10.21608/ejfs.2022.170239.1142
Sadh P.K., Chawla P., & Duhan J.S. (2018). Fermentation approach on phenolic, antioxidants and functional properties of peanut press cake. Food Bioscience, 22, 113–120. 10.1016/j.fbio.2018.01.011
Saeed M.A. (2010). Food processing for catering in spas (Doctoral dissertation). Food Science Department, Faculty of Agriculture, Moshtohor, Benha University, Egypt.
Sarepoua E., Tangwongchai R., Suriharn B., & Lertrat K. (2015). Influence of variety and harvest maturity on phytochemical content in corn silk. Food Chemistry, 169, 424–429. 10.1016/j.foodchem.2014.07.136
Sharoba A., Farrag M., & Abd El-Salam A. (2013). Utilization of Some Fruits and Vegetables Wastes As a Source of Dietary Fibers in Cake Making. Journal of Food and Dairy Sciences, 4, 433–453. 10.21608/jfds.2013.72084
Singh S. (2008). Development of high protein biscuits from green gram flour manufactures.
Singh J., Inbaraj B.S., Kaur S., Rasane P., & Nanda V. (2022). Phytochemical analysis and characterization of corn silk (Zea Mays, G5417). Agronomy, 12, 777. 10.3390/agronomy12040777
Singh J., Rasane P., Nanda V., & Kaur S. (2023). Bioactive compounds of corn silk and their role in management of glycaemic response. Journal of Food Science and Technology, 60, 1695–1710. 10.1007/s13197-022-05442-z
Sousa C.M. de M., Silva H.R.E, Vieira G.M. Jr., Ayres M.C.C., Costa C.L.S. da, Araújo D.S., Cavalcante L.C.D., Barros E.D.S., Araújo P.B. de M., Brandão M.S., & Chaves M.H. (2007). Fenóis totais e atividade antioxidante de cinco plantas medicinais. Química Nova, 30, 351–355. 10.1590/S0100-40422007000200021
Spinoso-Castillo J.L., Escamilla-Prado E., Aguilar-Rincón V.H., Morales Ramos V., de los Santos G.G., Pérez-Rodríguez P., & Corona-Torres T. (2020). Genetic diversity of coffee (Coffea Spp.) in Mexico evaluated by using DArTseq and SNP markers. Genetic Resources and Crop Evolution, 67, 1795–1806. 10.1007/s10722-020-00940-5
Sudha M.L., Vetrimani R., & Leelavathi K. (2007). Influence of fibre from different cereals on the rheological characteristics of wheat flour dough and on biscuit quality. Food Chemistry, 100(4), 1365–1370. 10.1016/j.foodchem.2005.12.013
Tian S., Sun Y., & Chen Z. (2021). Extraction of flavonoids from corn silk and biological activities in vitro. Journal of Food Quality, 2021, 1–9. 10.1155/2021/7390425
Vieira M.A., Tramonte K.C., Podestá R., Avancini S.R.P., Amboni R.D.de M.C., & Amante E.R. (2008). Physicochemical and sensory characteristics of cookies containing residue from King Palm (Archontophoenix Alexandrae) processing. International Journal of Food Science & Technology, 43(8), 1534–1540. 10.1111/j.1365-2621.2007.01568.x
Waheed A., Rasool G., & Asghar A. (2010). Effect of interesterified palm and cottonseed oil blends on cookie quality. Agricultural and Biological Journal of North America, 1(4), 402–406. 10.5251/abjna.2010.1.3.402.406
Wang K.-J., & Zhao J.-L. (2019). Corn silk (Zea Mays L.), a source of natural antioxidants with α-amylase, α-glucosidase, advanced glycation and diabetic nephropathy inhibitory activities. Biomedicine & Pharmacotherapy, 110, 510–517. 10.1016/j.biopha.2018.11.126
Yeşlada E., & Ezer N. (1989). The antiinflammatory activity of some sideritis species growing in Turkey. International Journal of Crude Drug Research, 27, 38–40. 10.3109/13880208909053936
Yıldırım, A., & Atasoy, A. (2020). Quality characteristics of some durum wheat varieties grown in Southeastern Anatolia Region of Turkey (GAP). Harran Tarım ve Gıda Bilimleri Dergisi, 24(4), 420–431.
Zhao H., Zhang Y., Liu Z., Chen J., Zhang S., Yang X., & Zhou H. (2017). Acute toxicity and anti-fatigue activity of polysaccharide-rich extract from corn silk. Biomedicine & Pharmacotherapy, 90, 686–693. 10.1016/j.biopha.2017.04.045
Žilić S., Janković M., Basić Z., Vančetović J., & Maksimović V. (2016). Antioxidant activity, phenolic profile, chlorophyll and mineral matter content of corn silk (Zea Mays L): comparison with medicinal herbs. Journal of Cereal Science, 69, 363–370. 10.1016/j.jcs.2016.05.003