
Download


REVIEW
Content of selected polyphenolic substances in parts of grapevine
Lenka Jurasova1†*, Tunde Jurikova2†, Mojmir Baron1, Jiri Sochor1
1Department of Viticulture and Enology, Faculty of Horticulture, Mendel University in Brno, Lednice, Czech Republic;
2Institute for Teacher Training, Faculty of Central European Studies, Constantine the Philosopher University in Nitra, Nitra, Slovakia
†These authors shared first authorship.
Abstract
This review provides an overview of the variety of occurrences, content, extraction and health effects of selected polyphenolic compounds associated with different parts of grapevine (seeds, peel, pulp and stems). The review provides a brief characterisation of grape parts, the content of polyphenolic compounds and their extraction together with their graphical forms of presentation and diversity as determined by different studies. The content of individual polyphenolic compounds differed with studies. Effects of different factors were evident in both growing style and geographical location of vineyards as well as extraction methods and analytical conditions.
Key words: grapevine, peel, polyphenolic compound, seed, skin, stem
*Corresponding Author: Lenka Jurasova, Department of Viticulture and Enology, Faculty of Horticulture, Mendel University in Brno, Valticka 337, 691 44 Lednice, Czech Republic. Email: [email protected]
Received: 7 November 2022; Accepted: 30 March 2023; Published: 18 July 2023
© 2023 Codon Publications
This is an Open Access article distributed under the terms of the Creative Commons Attribution-NonCommercial-ShareAlike 4.0 International (CC BY-NC-SA 4.0). License (http://creativecommons.org/licenses/by-nc-sa/4.0/)
Introduction
The aim of the review was to summarize the occurrence, distribution and determination of polyphenolic compounds in different parts of grapes. The review also demonstrated variations in the values of polyphenolic compounds with respect to the methods used as well as variations within varieties.
The polyphenolic compounds were selected based on the literature. Among the most studied polyphenolic compounds in grapes are catechin, epicatechin gallate, quercetin, resveratrol and gallic acid (GA). Owing to its simple structure among other factors, GA represents the most commonly used standard for determining total polyphenolic compounds. The aim of creating a comparative table was to focus on the current literature. The analytical methods used were listed for each compound. However, in the case of some less usual analytes, older sources (from 2003 onwards) were also used. For the purpose of clarity and to emphasise the diversity of individual results, all mass concentrations were converted to a common unit of µg/g. For determining concentration in solution, the units were changed to µg/mL. Moreover, this review considered polyphenols in accordance to their distribution in grapes reflecting their health benefits.
Polyphenolic compounds found in grapes, their distribution and health benefits
Polyphenols are a class of compounds comprising one or more phenolic hydroxyl groups bonded to at least one aromatic ring (Di Lorenzo et al., 2021). The majority of polyphenolic compounds are generated from phenylpropanoid and phenylpropanoid acetate pathway and represent 40% of organic carbon in plants. Classification of phenolic compounds is based on different approaches according to the functional group bound to phenol or the number of phenolic units found in the molecule, and this differs mainly according to studies. The easiest division of phenolic compounds is into flavonoids, the most studied group, and non-flavonoids. Nowadays, phenolic compounds are classified into groups and subgroups based on the number of phenolic rings and structural elements attached to the rings (Butterfield, Castegna, Lauderback, & Drake et al., 2002). According to this approach, the major classes represent phenolics, flavonoids, stilbenes and lignans (Pietta et al., 1998). The group of flavonoids, as the most abundant class in grapes or wine, can be represented by flavanols, flavones, flavanonols and anthocyanins (Nollet and Gutierrez-Uribe, 2018; Teixeira et al., 2018; Tsimogiannis and Oreopoulou, 2019).
Depending upon products (Nollet and Gutierrez-Uribe, 2018; Teixeira et al., 2018; Tsimogiannis and Oreopoulou, 2019), flavanols, flavones, flavanonols and anthocyanins belong to a group of flavonoids, and are the most abundant polyphenols present in grapes or wine and related products. Other explanation divided polyphenolic into the following sub-classes: coumarins, furanocoumarins stilbenes, tannins, lignans, lignins, monolignols, anthocyanins, isoflavones, chalcones, naphthoquinones and anthraquinones, and diarylheptanoids. As observed, phenol sorting is not dogmatic, and it depends, in particular, on the purpose of dividing them (Brenes et al., 2016).
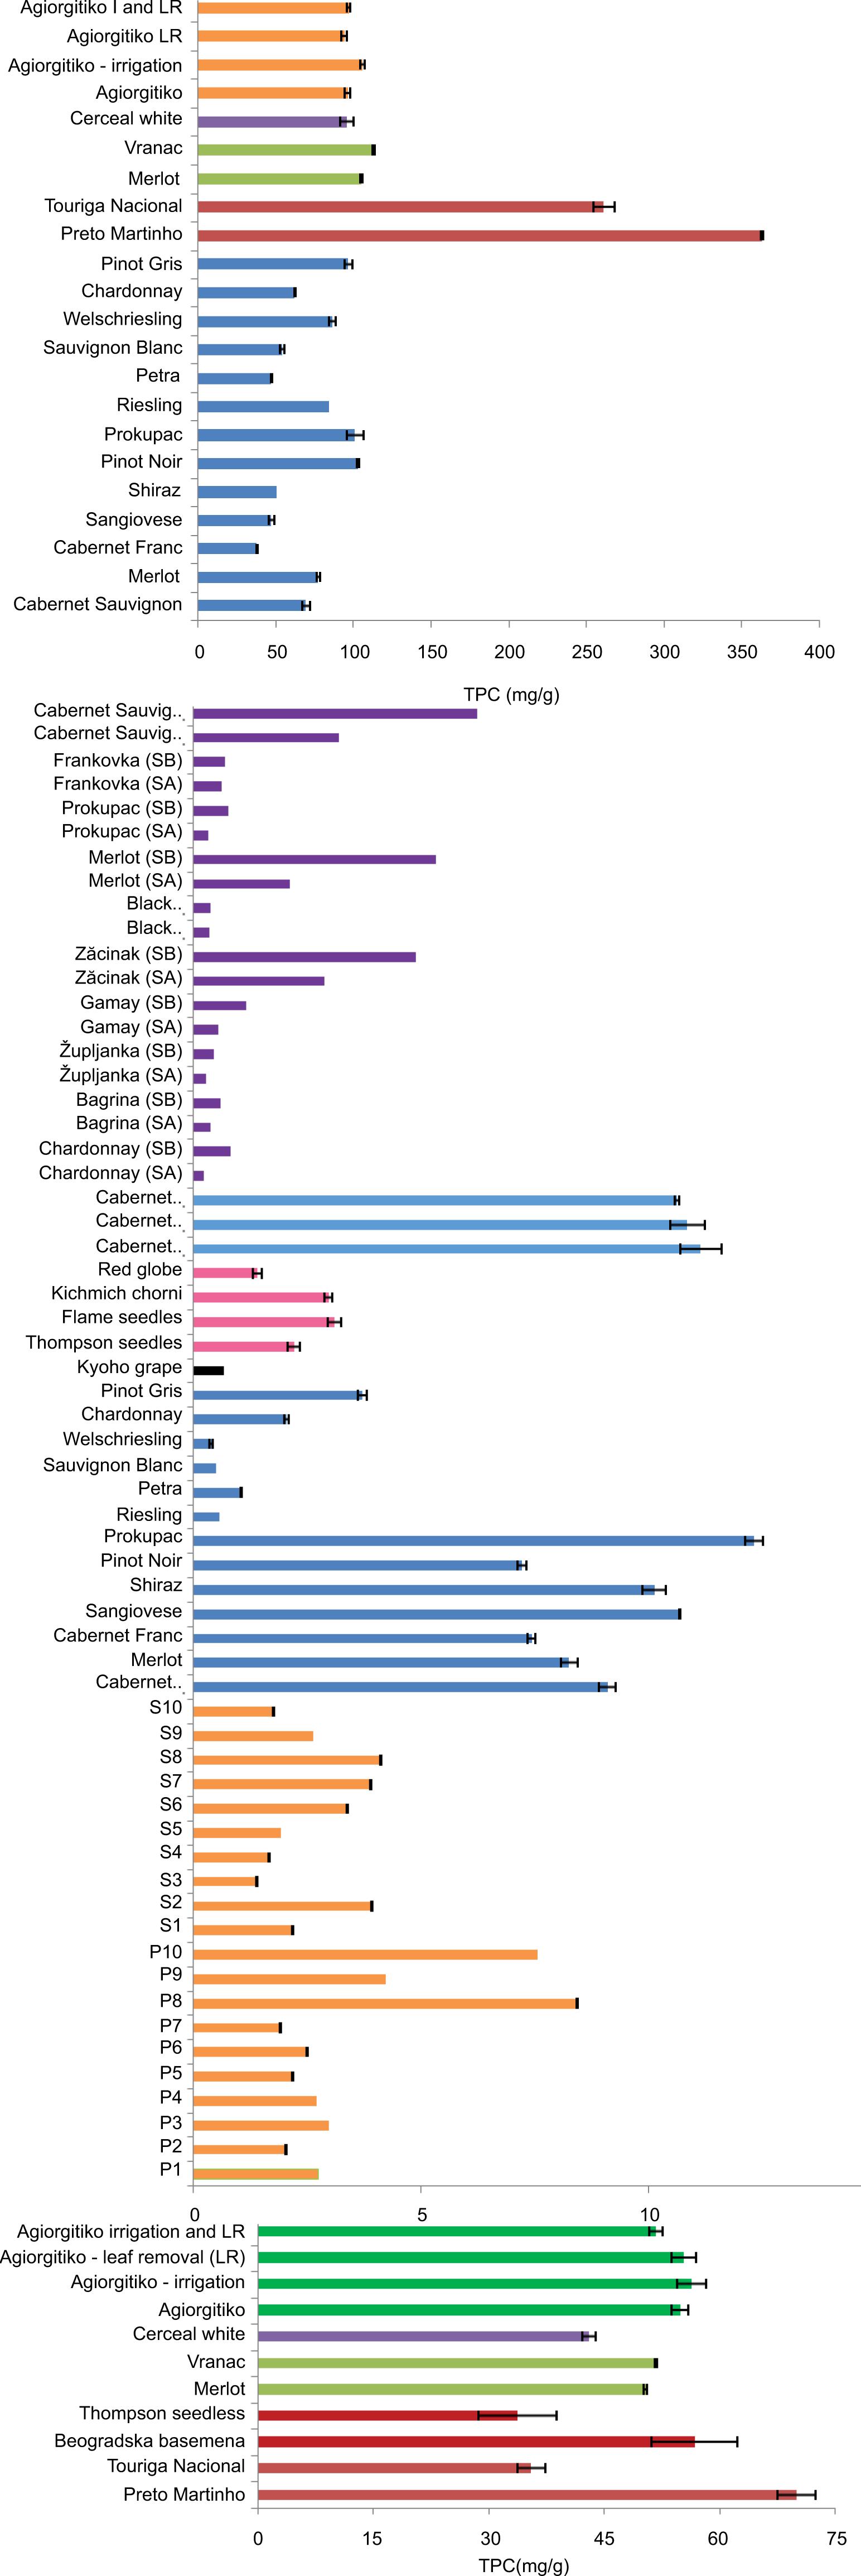
The distribution of polyphenols within a grape bunch is different as shown in Figures 1–4.
Figure 1. Graph shows the values of total polyphenols by using Folin’s reagent in seeds. Values are expressed in milligram of GA equivalent to per gram of seeds, except for Silva et al. (2018), where the equivalent is epicatechin gallate. The same colour shows the measurements of one research group. Next to each bar is the description indicating the variety used for measurements. SA: solvent A; AcEtOH: acidified aqueous ethanol; SB: solvent B; ChCit: choline chloride:citric acid; I: irrigation; LR: leaf removal. Light blue (Castro-Lopez et al., 2019), purple (Dabetic´ et al., 2020), green (Chorti et al., 2016), yellow (Dinis et al., 2020), grey (Radovanovic´ et al., 2019), orange (Silva et al., 2018) and dark blue (Pantelic´ et al., 2016).
Figure 2. Graph shows the values of total polyphenols by using Folin’s reagent in grape peel. Values are expressed in milligram of GA equivalent to per gram of peel. The same colour shows the measurements of one research group. Below each bar is the description indicating the variety used for measurements. SA: solvent A; AcEtOH: acidified aqueous ethanol; SB: solvent B; ChCit: choline chloride:citric acid; P1-10: samples from Piranshahr city; S1-10: samples from Sardasht city. Purple (Dabetic´ et al., 2020), light blue (Castro-Lopez et al., 2019), pink (Singha and Das, 2015), black(Ni et al., 2017), dark blue (Radovanovic´ et al., 2019), light green (Khoshamad et al., 2020), dark green (Chorti et al., 2016), yellow (Dinis et al., 2020), grey (Radovanovic´ et al., 2019), red (Baiano and Terracone, 2012) and orange (Silva et al., 2018)Figure 2. Continued.
Figure 3. Graph shows the values of total polyphenols by using Folin’s reagent in grape pulp. Values are expressed in milligram or microgram of GA equivalent to per gram of pulp. The same colour shows the measurements of one research group. Below each bar is the description indicating the variety used for measurements. P1-10: samples from Piranshahr city; S1-10: samples from Sardasht city. Yellow (Dinis et al., 2020), red (Baiano and Terracone, 2012), green (Khoshamad et al., 2020), pink (Singha and Das, 2015), black (Ni et al., 2017) and blue (Pantelic et al., 2016).
Figure 4. Graph shows the values of total polyphenols by using Folin’s reagent in grape stems. Values are expressed in milligram of GA equivalent to per gram of stems, except for Silva et al. (2018), where the equivalent is epicatechin gallate. The same colour shows the measurements of one research group. Below each bar is a description indicating the variety used for measurements. Grey (Radovanovic´ et al., 2019), green (Leal et al., 2020), yellow (Hanušovský et al., 2020), blue (Domínguez-Perles et al., 2014) and orange (Silva et al., 2018).
The content, abundance and distribution of polyphenolic compounds in grapevines are highly dependent on the geographical and climatic conditions, grape variety, cultivation processes and the stage of ripeness. However, there is no doubt that Vitis vinifera is one of the most important sources of polyphenolic substances, especially wine industry wastes (grape skin, stems and seeds), which represent 20% of the weight of processed grapes (Teixeira et al., 2018) and therefore are a matter of growing interest and emphasis for farmers.
As mentioned above, the concentration of polyphenols varies not only between plant species but also between plant parts. Thus, in the following sections, seeds, peels, pulp and stems are described separately. The most abundant group of polyphenols found in grapes are flavanols, represented by simple monomers of catechin and epicatechin gallate, oligomeric proanthocyanidins (OPCs; 2–5 units), and condensed tannins (polymers of more than five phenolic units), mainly present in the pulp (Crozier et al., 2008). The most abundant form of flavanol group is catechin, mainly found in grape skin and seeds, and traces of monomers or dimers are discovered in grape pulp.
The phenolic hydroxyl group is relatively acidic compared with other hydroxyl groups because of its bond to the aromatic ring, causing deprotonation of the oxygen substituent and stabilisation of the complex. It causes reactivity and determines phenols as the building blocks of polymers, such as lignins or suberins, as well as their involvement in the production of wide spectra of compounds in plants. Owing to their chemical variety, polyphenols have different functions in plants. Many of them are involved in providing defence against herbivores and pathogens. Other phenols have a mechanical function and are pollinator attractants, adsorb ultraviolet (UV) rays and reduce the growth of surrounding competitive plants.
Polyphenols could have a negative allelopathic effect if released from the leaves, roots or decomposing plant tissues. To compete with surrounding plants for water, sunlight and minerals, plants release phenols that may inhibit the growth of adjacent plants. This effect could possibly be utilised in the production of genetically modified plants that produce compounds with allelopathic effects to eradicate weeds (Crozier et al., 2008; Novak et al., 2008; Taiz et al., 2015). Polyphenolics played an important role in overcoming the challenges of water-to-land transition. As an example, the evolution of phenylpropanoid pathway in primitive terrestrial plants and algae helped them to adapt to exposition to UV radiation even before transition to land. This pathway leads to the production of more than 5,000 compounds called flavonoids. The land ecosystem means decline of water sources, resulting in the formation of a group of substances called suberins. These are polymers of phenolic (hydrophilic) and aliphatic (hydrophobic) groups important in forming periderm in the root and bark because they provide a hydrophobic barrier and prevent water loss. Suberins are the main component of the cork and provide physical barrier against pests. Lignin is a trimer from monolignol monomers that toughen cellulose fibres in specialised cell wall structures in tracheids and vessels. These structures allow the carrying of plant’s weight on land, which is not required in the aquatic environment, and transportation of water and minerals from the roots to all plant tissues. Lignin formation helped plants to overcome the pull of gravity and compete for sunlight with other plants (Novak et al., 2008; Taiz et al., 2015).
Last but not least, in addition to many changes, challenges and problems, plants were exposed to a new spectrun of pathogens and herbivores. To deal with this challenge, different subgroups of phenolics that mediate chemical defence, and thus have antiherbivorous, insecticidal and allelopathic (interaction) effects and prevent the spread of fungi and bacteria, were evolved. Owing to their toxicity, phenolic metabolites do not occur in the form of free aglycones but are conjugated with cell wall components or generate conjugated glycosides (GL). In addition to the toxic effects, phenols are responsible for the colour, aroma, taste and antioxidative properties of plant organs (War et al., 2012).
Grapes and their products have displayed a wide range of utilisation. Grape by-products have been used for feeding agriculturally important animals with different results. The feeding of chickens by grape pomace and seed extracts led to improvement in growth in a study conducted by Liu et al. (2014). On the other hand, no significant increase in the growth was observed in chickens fed with grape seed extracts (GSE) and grape pomace (Brenes et al., 2016; Chamorro et al., 2015).
A positive boost in growth could be explained due to various reasons. GSE inhibits growth of the pathogen causing coccidiosis oxidative stress (Wang et al., 2008), reduces meat lipid oxidation (Brenes et al., 2016; Iqbal et al., 2015) and increases the abundance of polyunsaturated fatty acids in poultry meat (Chamorro et al., 2015). Other studies showed a significant effect on pigs’ metabolism after the feeding of grape marc meal or grape pomace. Intake of grape by-products improved nitrogen metabolism and growth, modified fatty acid patterns in subcutaneous fat (Yan and Kim, 2011), and increased feed conversion ratio and antimicrobial effect on Escherichia Coli in the faeces of weaned pigs after feeding with grape by-product (Fiesel et al., 2014).
In contrast, no effect on the growth of rabbits was observed (Nicodemus et al., 2007; Tortuero et al., 1994). Moreover, in the study conducted by Ferreira et al. (1996), feeding rabbits with grape pomace led to a decrease in feed conversion ratio. No change in the production or composition of milk was observed in case of dairy cows fed with grape pomace or marc (Eleonora et al., 2014; Hansen and Nielsen, 2004). However, Moate et al. (2014) described an increase of monosaturated fatty acids, polysaturated fatty acids and linoleic acid in milk after feeding cows with ensiled or dried grape marc. Feeding with grape marc decreased weight gain in beef cattle (Manterola et al., 1997), and the presence of lignin, tannin and fibre decreased nutrients’ digestibility in fatting lambs after feeding them with grape pomace (Eleonora et al., 2014). In contrast, Abarghuei et al. (2010) showed a positive effect on retained nitrogen and ruminal parameter in sheep fed with grape pomace. Numerous experiments confirmed the use of grape by-products as a nutrient for farm animals. Different effects of feeding grape by-products are caused due to different production processes used in wineries, affecting the quality of grape by-products, and also variations among cultivars (Gierus et al., 2020; Milder et al., 2005).
Polyphenolic compounds of grape seeds, distribution, extraction and health potential
Grape seeds are pear shaped with a trigone transverse section. The seeds are composed of a cuticle, an epidermis and two integuments going around the albumen and the embryo (Cadot et al., 2006). Development of the seed and fruit are related. Their maximum fresh weight (fw) occurs during colouring of berries, while maximum dry seed weight coincides with maximum berry weight (Ristic and Iland, 2005). Colour of seeds varies from green to dark brown during maturation (Kennedy et al., 2000). Change of colour, along with hardening, is concomitant with the oxidation of phenolics and maturing of the bunch (Cadot et al., 2006).
Grape seeds are composed of fibre (40%), volatile oils (16%), protein (11%), polyphenolic compounds (7%) and other substances (sugars, minerals etc.; de Campos et al., 2008). Within the grapes, soluble phenols are distributed unevenly, with dominant representation in seeds (70%), 28–35% found in skins and, in spite of their large volume, the least presence of 10% is found in pulp. Supported by various studies (Cheng et al., 2012; Makris et al., 2007), total polyphenols are maximum in seeds among different analysed grape components in different vine varieties.
Catechin and epicatechin gallate are the most abundant phenolic compounds present in the seeds and stems. Within flavonols, the main representative phenol is rutin (Cheng et al., 2012; Makris et al., 2007). Presence of different phenols is affected by genetic diversity between varieties, regions, light intensity, soil compositions, climatic and agronomic conditions, ripening stages, processes of extraction and storage conditions (de la Cerda-Carrasco et al., 2015; Jordão et al., 2001; Nassiri-Asl and Hosseinzadeh, 2009).
Presence of the most abundant oligomers is different between plant compositions. The major oligomer found in the seeds, according to different studies, is procyanidin B2. On the other hand, procyanidin B1 is reported to be the dominant oligomer in the skin and bunch stems (Dwyer et al., 2014; Topalovic and Mikulic-Petkovsek, 2010; Vujasinović et al., 2021). Despite differences, the studies showed the highest content of polphenols in the following order: the highest concentration was in the seeds followed by the berry skins and must (mustum or young wine) (Boso et al., 2019).
Antioxidant activity of grapes was confirmed by 1,1-Diphenyl-2-picrylhydrazyl (DPPH) and 2,2’-azino-bis(3-ethylbenzothiazoline-6-sulfonic acid) (ABTS) assays, where the highest was found in seed extracts, followed by stem and skin extracts. The higher antioxidant capacity of the seeds may correlate with its higher total phenolic content (TPC), supported by previous results that phenols, dominantly found in the seeds, possess antioxidant activity.
Surprisingly, a negative correlation between the content of phenolics and EC50 describing antioxidant activity was proven by Wen et al. (2016), suggested that among phenolics, antioxidant activity is the combined effect of phenolic compounds, sterols and vitamin E. On the other hand, a negative relationship was observed between the quantity of tocols and the content in total phenol (Vujasinović et al., 2021).
Extraction of grape polyphenols in the seeds is dependant upon two conditions, dissolution of concrete polyphenolic compounds in the plant material matrix, and their diffusion in the external solvent medium. Ethanol as an extracting solvent was shown to be an efficient method of extracting polyphenol. Nawaz et al. (2006) studied different conditions of extraction of polyphenols from grape seeds using 50% ethanol and 50% water as solvents. When compared with a GA standard, extraction of grape seed polyphenols with a 0.2-g/mL solid to liquid ratio, double-stage extraction, and 0.22-m pore size membrane seem to be the most optimal conditions (polyphenols represents 11.4% of the total seeds weight). In respect of concrete polyphenols, it mostly depends on the applied method.
As an example, monomeric procyanidins are found in large amounts in grape seeds, but the quantity of extraction is low due to their low water solubility. Therefore, methods utilising solvents with lower polarity (Soxhlet, supercritical fluid extraction (SFE) and ethanol-assisted extraction) are preferred to increase extractability (Colibaba et al., 2015). In their findings, the choice of solvent used for extraction and the effect of extraction were supported by the Teixeira group, who tested three different solvents and three different methods for extraction. Specifically, Soxhlet, ultrasound extraction, and maceration were performed, and methanol, ethanol and, acetone with different polarities were used as solvents, with the highest TPC using 70% acetone, followed by 70% ethanol extract and 70% methanol extract. However, comparable results were obtained with different extraction methods (Teixeira et al., 2014).
Extraction efficiency does not only depend on the selection of the solvent but also on the extracted phenolic compound. The utilisation of ethyl acetate for extraction showed a large recovery effect on flavonols, whereas methanol was the preferred solvent for flavan-3-ol (catechin, epicatechin gallate and epigalocatechin) extraction. Owing to the low permeability of tissues to non-polar aprotic solvents, addition of water to the solvent increases process efficiency. As an example, the efficiency of proanthocyanidin extraction was significantly increased by adding water to acetone or ethyl acetate. Moreover, the type of analysed material influences measured concentrations because of the relation between the number and weight of seeds, and weight and stage of berry ripening. For example, the highest content of catechin is at grape veraison; then the concentrations decrease until near maturity (Downey et al., 2003; Freitas and Glories, 1999; Kennedy et al., 2000). Also, decline of monomeric flavanols is more rapid than oligomers because of increasing polymerisation during maturity.
Many positive effects of polyphenolic compounds extracted from seeds have been described for human health, especially their ability to decrease the occurrence of heart disease. Polyphenols mostly contribute to lower the oxidation levels of low-density lipoprotein cholesterol and blood pressure, enhance the functioning of endothelium, reduce inflammation and platelet aggregation, and decrease cell senescence by inhibiting novel proteins activating this process (Dohadwala and Vita, 2009; Moreno et al., 2003; Shi et al., 2003). Grape seed extracts, through their inhibition of enzymes lipoprotein lipase and pancreatic lipase involved in fat metabolism, could be utilised as a dietary supplement to limit fat absorption and fat accumulation in tissues (Bagchi et al., 2000). Intake of grape extracts by mice resulted in reducing myocardial injury and myocardial ischemia-reperfusion and decrease of superoxide anion production as well as platelet adhesion and aggregation (Bagchi et al., 2000; Karthikeyan et al., 2007; Olas et al., 2008). In addition, procyanidins from GSEs have demonstrated inhibition of thrombus formation in mice after oral and intravenous administration (Sano et al., 2005).
Moreover, Anastasiadi et al. (2012) proved that extracts having abundance of flavonoids and its derivatives from grape seeds, along with the occurrence of phenolic acids, stilbenes and flavonoids from grape stems, possess antimicrobial properties. The antimicrobial activities of several non-flavonoid phenolic compounds from wine were tested, and vanillic and GA exhibited inhibitory effects towards K. pneumoniae and E. coliand (Vaquero et al., 2007). It has been demonstrated that extracts from red grape seeds inhibit the growth of important human pathogens, such as E. coli, Candida albicans, Listeria monocytogenes and Salmonella typhimurium. Moreover, proanthocyanidins are indicated as dominant components in the protective prevention of inflammation mediated through the reduction of Faecalibacterium prausnitzii in the intestinal lumen, leading to the blockade of inflammatory response cascade in the gut.
In the central nervous system of mice, the beneficial effects of GSE to modulate lipid peroxidation and oxidative damage of DNA bases were observed (Balu et al., 2006; Feng et al., 2005; Teixeira et al., 2014).
For the above-mentioned reasons, a growing interest is observed in the use of grape seeds, and because the highest phenolic content is found in seeds, production of grape seed oil (GSO) is increasing. Consumption of GSO is reported to be beneficial to health, especially because of its high content of phenolic compounds, unsaturated fatty acids, pigments, tocopherols and low cholesterol. In spite of relatively small presence of the mentioned compounds, GSO has been determined as a food supplement with considerably positive health effects. GSO and its components show health protective effects from antiradical, antioxidant and vitamin activity to a high metabolic value in the body (Assumpção et al., 2016; Fernandes et al., 2013).
Bioactive anticancer, antimutagenic and anti-lipid effects and reduction in the risk of cardiovascular diseases qualify GSO to be used as a supplement in food and pharmaceutical industries (Garavaglia et al., 2016; Shinagawa et al., 2015). Comparing GSO of red and white grapes, on average, higher content of phenolic compounds was found in GSO from red varieties, with the highest content found in the Hamburg variety (336.3 ± 4.8 μg/g) in accordance with the study conducted by Vujasinović et al. (2021), declaring higher content of phenols in GSE.
Figure 1 shows that in spite of using the same analytical method (values of total polyphenols), the results of individual studies vary widely.
Table 1 shows the content of individual polyphenolic components monitored in grape seeds, depending on the analytical method used.
Table 1. Comparison of concentrations of selected major polyphenolic compounds presented in grapevine seeds according to studies.
| Analyte | Concentration (µg/g or % w/w*) | Analytical method | Concentration in | Studies |
|---|---|---|---|---|
| Gallic acid | 10,580–105,000 | HPLC/DAD | Dry weight | Cotea et al. (2018) |
| 300–6,700 | HPLC/UV-VIS | Residue | Silva et al. (2018) | |
| 3,130–3,210 | HPLC/DAD | Dry weight | Radovanovic´ et al. (2019) | |
| 745–2,450 | HPLC/DAD | Dry weight | Dabetic´ et al. (2020) | |
| 310–270 | HPLC/DAD | Extract | Aybastier et al. 2018 | |
| 0.02–2.06* | HPLC/DAD | Extract | Nakamura et al. 2003 | |
| 210–1,250 | HPLC/PDA | Dry weight | Bucic´-Kojic´ et al. (2009) | |
| 4,000 | HPLC/DAD/QMS | Extract | Chamorro et al. (2012) | |
| Catechin | 820 | HPLC/DAD | Dry weight | Cotea et al. (2018) |
| 7,700–17,200 | HPLC/UV-VIS | Residue | Silva et al. (2018) | |
| 456.66–823.90 | HPLC/MS/QTOF | Dry weight | Boso et al. (2019) | |
| 7,620–8,080 | HPLC/DAD | Dry weight | Radovanovic´ et al. (2019) | |
| 2,911–15,587 | HPLC/DAD | Dry weight | Dabetic´ et al. (2020) | |
| 1,360 | HPLC/DAD | Extract | Aybastier et al. (2018) | |
| 1.03–4.93* | HPLC/DAD | Extract | Nakamura et al. (2003) | |
| 1,790–6,640 | HPLC/PDA | Dry weight | Bucic´-Kojic´ et al. (2009) | |
| 8,000 | HPLC/DAD/QMS | Extract | Chamorro et al. (2012) | |
| 674–1,418 | HPLC/DAD | Dry weight | Iacopini et al. (2008) | |
| Epicatechin gallate | 11,200–25,500 | HPLC/UV-VIS | Residue | Silva et al. (2018) |
| 429.86–445.20 | HPLC/MS/QTOF | Dry weight | Boso et al. (2019) | |
| 10,340–10,600 | HPLC/DAD | Dry weight | Radovanovic´ et al. (2019) | |
| 948–6,269 | HPLC/DAD | Dry weight | Dabetic´ et al. (2020) | |
| 790–6,200 | HPLC/PDA | Dry weight | Bucic´-Kojic´ et al. (2009) | |
| 8,000 | HPLC/DAD/QMS | Extract | Chamorro et al. (2012) | |
| 472–2,057 | HPLC/DAD | Dry weight | Iacopini et al. (2008) | |
| Trans-resveratrol | 3,940–4,990 | HPLC/DAD | Dry weight | Cotea et al. (2018) |
| 7.11–37.93 | HPLC/DAD | Dry weight | Silva et al. (2018) | |
| Ferulic acid | 11,210–16,290 | HPLC/DAD | Dry weight | Cotea et al. (2018) |
| 3,100–11,800 | HPLC/UV-VIS | Residue | Silva et al. (2018) | |
| Procyanidin B1 | 420–1,410 | HPLC/DAD | Dry weight | Cotea et al. (2018) |
| 97.75–106.27 | HPLC/MS/QTOF | Dry weight | Boso et al. (2019) | |
| 0.7–1.73* | HPLC/DAD | Extract | Nakamura et al. (2003) | |
| 6,000 | HPLC/DAD/QMS | Extract | Chamorro et al. (2012) | |
| Procyanidin B2 | 310–670 | HPLC/DAD | Dry weight | Cotea et al. (2018) |
| 141.92–149.00 | HPLC/MS/QTOF | Dry weight | Boso et al. (2019) | |
| 7,600–7,860 | HPLC/DAD | Dry weight | Radovanovic´ et al. (2019) | |
| 0.66–1.54* | HPLC/DAD | Extract | Nakamura et al. (2003) | |
| 450–5,670 | HPLC/PDA | Dry weight | Bucic´-Kojic´ et al. (2009) | |
| 5,000 | HPLC/DAD/QMS | Extract | Chamorro et al. (2012) | |
| Vanillic acid | 5,360–13,020 | HPLC/DAD | Dry weight | Cotea et al. (2018) |
| 500–1,500 | HPLC/UV-VIS | Residue | Silva et al. (2018) | |
| Epicatechin gallate | 13,880–15,500 | HPLC-DAD | Dry weight | Radovanovic´ et al. (2019) |
| 20–80 | HPLC/PDA | Dry weight | Bucic´-Kojic´ et al. (2009) | |
| 2,000 | HPLC/DAD/QMS | Extract | Chamorro et al. (2012) | |
| Rutin | 6.74–9.37 | HPLC/DAD | Dry weight | Szabó et al. (2021) |
HPLC: high-performance liquid chromatography; DAD: diode-array detection; PDA: photodiode array; QMS: quadrupole mass spectrometry; MS: mass spectrometry; QTOF: quadrupole time of flight.
Table 2. Comparison of concentrations of selected analytes in grapevine peel according to studies.
| Analyte | Concentration (µg/g or % w/w**) |
Analytical method | Concentration in | Studies |
|---|---|---|---|---|
| Resveratrol | 6–255 | HPLC/DAD | Dry weight | Iacopini et al. (2008) |
| 4,700–8,400 | HPLC/UV-VIS | Residue | Silva et al. (2018) | |
| 9.7 | HPLC/PDA | Fresh weight | Ni et al. (2017) | |
| 21.5–174 | HPLC/DAD | Dry weight | Chafer et al. (2005) | |
| 9.2–29.8 | HPLC/PDA | Dry weight | Farhadi et al. (2016) | |
| 5.64–13.42 | UHPLC/DAD/MSMS | Frozen sample | Pantelic´ et al. (2016) | |
| Rutin | 403–1,690 | HPLC/DAD | Dry weight | Iacopini et al. (2008) |
| 140–150 | HPLC/DAD | Dry weight | adovanovic´ et al. (2019) | |
| 9,800–27,000 | HPLC/UV-VIS | Residue | Silva et al. (2018) | |
| 15.1–54.4 | HPLC/DAD | Dry weight | Chafer et al. (2005) | |
| 208–298 | HPLC/PDA | Dry weight | Farhadi et al. (2016) | |
| 0.88–38.97 | UHPLC/DAD/MSMS | Frozen sample | Pantelic´ et al. (2016) | |
| Quercetin | 2.9–10.07 | HPLC/DAD | Dry weight | Iacopini et al. (2008) |
| 40–50 | HPLC/DAD | Dry weight | Radovanovic´ et al. (2019) | |
| 72.1–254.7 | HPLC/DAD | Dry weight | Chafer et al. (2005) | |
| 306–405 | HPLC/PDA | Dry weight | Farhadi et al. (2016) | |
| 0.57–121.94 | UHPLC/DAD/MSMS | Frozen sample | Pantelic´ et al. (2016) | |
| Gallic acid | 600–800 | HPLC/UV-VIS | Residue | Silva et al. (2018) |
| 1,360–1,400 | HPLC/DAD | Dry weight | Radovanovic´ et al. (2019) | |
| </=1,200 | HPLC/DAD | Dry weight | Teixeira et al. (2014) | |
| 122–319 | HPLC/PDA | Dry weight | Farhadi et al. (2016) | |
| 2.34–8.76 | UHPLC/DAD/MSMS | Dry weight | Pantelic´ et al. (2016) | |
| Epicatechin gallate | 12,000–23,500 | HPLC/UV-VIS | Residue | Silva et al. (2018) |
| ND | HPLC/DAD | Dry weight | Radovanovic´ et al. (2019) | |
| 28–263 | HPLC/PDA/MSMS | Fresh weight | Rusjan and Mikulic-Petkovsek (2017) | |
| 1.26–4 | HPLC/MS/QTOF | Dry weight | Boso et al. (2019) | |
| 91.5–233.6 | HPLC/DAD | Dry weight | Chafer et al. (2005) | |
| 232–482 | HPLC/PDA | Dry weight | Farhadi et al. (2016) | |
| 2.95–3.56 | UHPLC/DAD/MSMS | Frozen sample | Pantelic´ et al. (2016) | |
| 32–5,219 | HPLC/DAD | Dry weight | Dabetic´ et al. (2020) | |
| Protocatechic acid | 2,300–7,200 | HPLC/UV-VIS | Residue | Silva et al. (2018) |
| 1.5–2.4 | HPLC/FD | Fresh weight | Teixeira et al. (2014) | |
| 0.4–0.55 | UHPLC/DAD/MSMS | Frozen sample | Pantelic´ et al. (2016) | |
| 65–1,663 | HPLC/DAD | Dry weight | Dabetic´ et al. (2020) | |
| Catechin | 4.83–19.65 | HPLC-MS-QTOF | Dry weight | Boso et al. (2019) |
| 48–178 | HPLC/PDA/MSMS | Fresh weight | Rusjan and Mikulic-Petkovsek (2017) | |
| 1,890–2,020 | HPLC/DAD | Dry weight | Radovanovic´ et al. (2019) | |
| 29,800–55,800 | HPLC/UV-VIS | Residue | Silva et al. (2018) | |
| 536–897 | HPLC/DAD | Dry weight | Chafer et al. (2005) | |
| 567–945 | HPLC/PDA | Dry weight | Liu et al. (2018) | |
| 3,27–7,47 | UHPLC/DAD/MSMS | Frozen sample | Pantelic´ et al. (2016) | |
| 17–307 | HPLC/DAD | Dry weight | Dabetic´ et al. (2020) | |
| Myricetin GL | 80–90 | HPLC/DAD | Dry weight | Radovanovic´ et al. (2019) |
| 7.7–46.64 | UHPLC/DAD/MSMS | Frozen sample | Pantelic´ et al. (2016) | |
| Epigallocatechin gallate | 1.9–2.42 | UHPLC/DAD/MSMS | Frozen sample | Pantelic´ et al. (2016) |
HPLC: high-performance liquid chromatography; UHPLC: ultra high-performance liquid chromatography; DAD: diode-array detection; PDA: photodiode array; QMS: quadrupole mass spectrometry; MS: mass spec-trometry; QTOF: quadrupole time of flight; FD: fluorescence detection; GL: glucoside.
The results of individual studies are different. These differences are due to the choice of the solvent, the standard used, different laboratory conditions, different maturity conditions, and characteristics of different varieties from different locations.
An overview of the most abundant polyphenolic compounds in grape seeds—their content and extraction
Gallic acid
Gallic acid, as one of the most representative phenolic compounds, was analysed by Cotea et al. (2018) using different extraction methods, attaining more than the 10th of dry weight (dw) in the Fetească neagră variety. The content of GA varies from 10.58 mg/g of dw using Soxhlet extraction to 105 mg/g of dw using the subcritical water extraction method. The use of 75% ethanol for extraction is more effective in comparison to water. Additionally, higher pressure (15 bar) was significantly more effective than using 3-bar pressure. Bucić-Kojić et al. (2009), Chamorro et al. (2012), Dabetić et al. (2020) and Radovanović et al. (2019) measured significantly lower concentrations of GA related to dry weight. Radovanović et al. (2019) reported concentrations of 3.21 and 3.13 mg of GA in g of dw extracted ultrasonically for 1 h with 40 mL of solvent system consisting of methanol:acetone:water:acetic acid mixture in the ratio of 30:42:27.5:0.5. Dabetić et al. (2020) described the impact of using different solvents for extraction—acidified aqueous ethanol (AAE), green solvent (GS) and choline chloride:citric acid (ChCit). Aybastıer et al. (2018) investigated the effect of addition of 10 M HCl in a methanol:water extraction composition with no significant differences. Nakamura et al. (2003) compared concentrations of GA in different health foods containing GSE, and obtained different concentrations of GA. Bucić-Kojić et al. (2009) discovered that 50% ethanol was more efficient for GA extraction than 70% or 96% strength.
Catechin
A high range of concentration, that is, 7,700–17,200 μg/g in residue was found by Silva et al. (2018). Dabetić et al. (2020) tested extraction with GS and compared it with AAE. It was observed that for each variety, the extraction reagents were effective in different manners. The lowest concentrations were found for the Gammay variety, where it was 3,020 μg/g for GS and 2,911 μg/g for AAE, with lower but statistically insignificant difference. On the other hand, higher concentrations were obtained for the Zupljanka cultivar using AAE solvent (15,587 μg/g) compared with GS (10,197 μg/g). These values were statistically significant. Radovanović et al.( 2019), who used ultrasonic extraction (1 h, 40 mL of solvent consisting of methanol:acetone:water:acetic acid in a ratio of 30:42:27.5:0.5), discovered the concentration of 7,620 μg/g and 8,080 μg/g for the Merlot and Vranac varieties. Bucić-Kojić et al. (2009) measured catechin concentration for the Frankovka variety. The authors applied three different concentrations of EtOH as an extraction solvent and obtained results in the range of 1,790–6,640 μg/g, with the 50% EtOH in water being the most effective concentration. Aybastıer et al. (2018) measured catechin in GSE (1,360 μg/g) and acid-hydrolysed GSE, where it was not observed. Iacopini et al. (2008), who studied more than seven varieties and clones, measured catechin in the range of 674–1,418 μg/g dw. Chamorro et al. (2012) used double extraction method with methanol–water and acetone–water combination, and obtained a concentration of around 8,000 μg/g of GSE. Different double extraction method was used by Boso et al. (2019) for the Mencía (457.66 μg/g) and Albariño (823.9 μg/g) varieties. A similar concentration of 820 μg/g dw was obtained through SFE by Cotea et al. (2018). Nakamura et al. (2003) obtained 1.03–4.93% w/w of catechin in GSE.
Epicatechin gallate
Silva et al. ( 2018) measured concentration of epicatechin gallate in extract residue of the Preto Martinho and Touriga Nacional varieties (25.5 mg/g and 11.2 mg/g, respectively). Comparing abundance of epicatechin gallate in dry weight, Radovanović et al. (2019) reported relatively high concentrations in the Merlot (10.34 mg/g) and Vranac (10.60 mg/g) varieties using ultrasonic extraction. Contrarily, Boso et al. (2019) reported concentrations of 0.445 mg/g in Albariño and 0.430 mg/g in Mencía varieties using double extraction method with methanol/water/formic acid (ratio: 50:49:1, v/v/v) and 20 mL acetone/water (ratio: 70:30, v/v). In the study conducted by Dabetić et al. (2020), usage of AAE for extracting epicatechin gallate led to higher efficiency, compared with the application of GS ChCit. Bucić-Kojić et al. (2009) compared different concentrations of ethanol for extracting epicatechin gallate with the highest efficiency by using 50% ethanol at 80°C (0.62 mg/g of dw). Iacopini et al. (2008) reported variance in concentration of epicatechin gallate among different varieties, with the highest concentration found in the Canaiolo variety. Chamorro et al. (2012) measured concentration, reaching 8 mg/g of dw and described the effect of heat treatment on antioxidant activity and polyphenolic content of grape pomace and GSE. Silva et al. (2018) reported relatively high concentrations of epicatechin gallate in the GSE residue of the Preto Martinho (25.5 mg/g) and Touriga Nacional (11.2 mg/g) varieties.
Epicatechin gallate
Relatively high concentrations of epicatechin gallate were measured after extraction with methanol:acetone: water:acetic acid concoction (ratio: 30:42:27.5:0.5) in the Merlot and Vranac varieties (Radovanović et al., 2019). Contrarily, use of different strengths of ethanol solution (96%, 70%, 50%) reported a low effective extraction concentration of 2 mg/g of dw of epicatechin gallate in the Frankovka variety (Bucić-Kojić et al., 2009; Chamorro et al., 2012) using a mixture of methanol/water (50:50, v/v, pH = 2), followed by acetone/water (70:30, v/v) extraction.
Procyanidin B1
Chamorro et al. (2012) measured 6,000 μg/g of procyanidin B1 in GSE. Cotea et al. (2018) tested subcritical water extraction with different solvents and pressures using Soxhlet extraction and supercritical fluid extraction. The last was found to be the most effective method and provided a result of 1,410 μg/g dw. Results of other extraction methods were from 420 to 640 μg/g dw. Boso et al. (2019) studied concentration of Procyanidin B1 in both Albariño and Mencía varieties, with respective results of 97.75 μg/g and 106.27 μg/g of dw. Nakamura et al. (2003) measured the concentration of 0.7–1.73% by volume in GSE.
Procyanidin B2
Compared with other studies, which related concentration to dry weight, Radovanović et al. (2019) measured the highest concentration of 7,860 μg/g. Cotea et al. (2018), who tested various extraction methods, obtained results in the range of 310–730 μg/g dw in the Fetească neagră variety. Bucić-Kojić et al. (2009) also optimised the extraction process and used three levels of ethanol concentration to obtain results from 450 to 5,670 μg/g dw, reaching the highest concentration when 50% ethanol was used. A similar high result was obtained by Chamorro et al. (2012), who determined procyanidin B2 in approximately 5,000 μg/mg of extract. Nakamura et al. (2003) reported a concentration of 0.66–1.54 in volume percentage of GSE. Boso et al. (2019) carried out double extraction method of seeds for both Albariño and Mencía varieties and obtained the results of 141.92 μg/g and 149.00 μg/g dw.
As mentioned above, Cotea et al. (2018) tested different types of extraction methods and, in addition to the already described analytes, studied resveratrol (3,940–4,990 μg/g dw), ferrulic acid (11,210–16,290 μg/g dw) and vanilic acid (5,360–11,220 μg/g dw). Resveratrol has been also studied by Szabó et al. (2021) in the Pinot Noir, Cabernet Sauvignon, Syrah and Blue Portugal varieties, arriving at concentrations ranging from 7.11 μg/g to 37.93 μg/g. In this wide range of analytes, the authors also studied rutin, typical of grapevine seeds, for which the obtained concentration was 6.74–9.37 μg/g. Silva et al. (2018) measured the concentration of vanillic acid in the residue seeds of the Preto Martinho (500 μg/g of residue) and Touriga Nacional (1,500 μg/g of residue) varieties. The concentration of Preto Martinho was close to the results reported by Cotea et al. (2018).
Polyphenolic compounds in peels and pulp of grapes—distribution, extraction and effects on health
Content of polyphenols in grape peels and pulp is generally lower than in seeds and bunch stems. Consequently, the abundance of analytes has been less investigated. Resveratrol, catechin and epicatechin gallate, procyanidin derivates, hydroxycinnamic acids, flavonols, stilbenes, anthocyanins and GA are the most abundant polyphenols found in grape peels and pulp. As in the case of seeds, the content of these compounds with the ability to neutralise free radicals is highly influenced by the cultivation and genotype of the grape variety (Boso et al., 2019).
Pantelić et al. (2016) determined hydroxybenzoic acid to be the most abundant polyphenolic compounds present in grape pulp; unequally minor quantities of the flavan-3-ols from peels of red and white varieties were also obtained. From the flavanol group, epigallocatechin gallate was only found in grape pulp.
As demonstrated by different studies, flavanols are the most abundant group of phenols found in grapes peel (Di Lecce et al., 2014; Georgiev et al., 2014; Pantelić et al., 2016). From this group, rutin and quercetin were found in all peel samples in the study conducted by Pantelić et al. (2016). In analysing the peels of white varieties, quercetin was the only flavonol with the highest concentration, except in the Chardonnay and Pinot Gris varieties, where concentration of rutin was predominant. Additionally, quercetin had the highest concentration in peels of red varieties, with the exclusion of Cabernet Franc and Pinot Noir, where concentration of myricetin (MYR) was predominant. These findings align with the results reported by Castillo-Muñoz et al. (2007), who reported myricetin as a typical flavanol of red grapes and wines. Comparing white and red varieties, the contents of flavan-3-ols in peels were of the same order between the groups, supported by the literature (Montealegre et al., 2006; Pantelić et al., 2016; Peña-Neira et al., 2004).
In contrast, Cook and Samman (1996) reported that, within the flavonoids, flavan-3-ols were most abundantly found in peels and seeds and in similar concentrations, and anthocyanins were the predominant group of phenols in grape peels.
Khoshamad et al. (2020) showed significant differences in total polyphenols, flavonoids and anthocyanins content in grape pulp and peels of 20 wild grape varieties. In different studies, the TPC of grape berries varied widely (Figures 1–4) because of environmental and genetic factors influencing the composition of grapes.
Hassanpour et al. (2011) also proved that TPC, as well as total anthocyanins and flavonoids, was affected by climate status in all studied varieties of grapes. The flavonoid content was higher in the varieties grown in the area with a high average annual temperature and low average annual humidity. In addition to the effect of climate, variation in TPC and anthocyanins within the varieties depended on soil composition and genetic factors. Antioxidant DPPH assay and fluorescence recovery after photo bleaching method proved that antioxidant activity was higher in peels than in pulp, correlating with its TPC and results of the study conducted by Guo et al. (2003).
Correlation between TPC and radical-scavenging activities (RSA) was confirmed by analysing grape seeds and skins and was different between red and white varieties. On the other hand, no correlation was discovered between TPC and RSA in pulp extracts (Pantelić et al., 2016).
Numerous extraction techniques are applied for the recovery of polyphenolic compounds from grape pulp and skin, including solid-liquid extraction, ultrasound-, microwave-, and enzyme-assisted extractions, etc. (Tomaz et al.et al., 2019). Solid-liquid extraction is the most utilized method for the recovery of phenols from grape pulp. Methanol (MeOH), ethanol (EtOH), acetone (ACE), ethyl acetate (EtAc) and their aqueous solutions are the most frequently used extraction solvents for the recovery of polyphenolics from grapes (Rusjan and Mikulic-Petkovsek, 2017; Yilmaz and Toledo, 2004). Enzyme-assisted extraction (EAE) has been mostly recommended for the recovery of polyphenolic compounds from grape skin. In recent years, enzyme-assisted extraction has become popular because of its low cost, excellent efficiency, and environment-friendly approach (Tomaz et al., 2019).
Table 3. Comparison of concentrations of selected polyphenolic componds in grapevine pulp according to studies.
| Analyte | Concentration (µg/g or µg/mL*) |
Analytical method | Concentration in | Studies |
|---|---|---|---|---|
| Resveratrol | <0.1 | HPLC/PDA | Fresh weight | Ni et al. (2017) |
| 9.2–28.7 | HPLC/PDA | Dry weight | Farhadi et al. (2016) | |
| nd | UHPLC/DAD/MSMS | Dry weight | Pantelic´ et al. (2016) | |
| Traces | HPLC/DAD | Palomino et al. (2000) | ||
| 0.00–4.29 | HPLC/DAD | Dry weight | Marshall et al. (2012) | |
| nd | HPLC/DAD | Dry weight | Wongnarat and Srihanam (2017) | |
| 11.14–39.75 | HPLC/PDA | Dry weight | Özcan et al. (2017) | |
| Gallic acid | 109–192 | HPLC/PDA | Dry weight | Farhadi et al. (2016) |
| 0.38–0.74 | UHPLC/DAD/MSMS | Frozen sample | Pantelic´ et al. (2016) | |
| 0.219–2.262 | HPLC/DAD | Fresh weight | Liu et al. (2018) | |
| 0.07–0.17 | HPLC/DAD | Fresh weight | Topalovic and Mikulic-Petkovsek (2010) | |
| 370–440 | HPLC/DAD | Dry weight | Wongnarat and Srihanam (2017) | |
| 125.54–567.47 | HPLC/PDA | Dry weight | Özcan et al. (2017) | |
| Catechin | 364–514 | HPLC/PDA | Dry weight | Farhadi et al. (2016) |
| nd | UHPLC/DAD/MSMS | Dry weight | Pantelic´ et al. (2016) | |
| 2.39–3.74 | HPLC/DAD | Fresh weight | Liu et al. (2018) | |
| 70–80 | HPLC/DAD | Dry weight | Topalovic and Mikulic-Petkovsek (2010) | |
| 0.05–0.151 | UV/VIS | Ivanova et al. (2010) | ||
| 31.39–760.081 | HPLC/PDA | Dry weight | Özcan et al. (2017) | |
| Epicatechin gallate | 149–234 | HPLC/PDA | Dry weight | Farhadi et al. (2016) |
| nd | UHPLC/DAD/MSMS | Dry weight | Pantelic´ et al. (2016) | |
| 0.630–2.464 | HPLC/DAD | Fresh weight | Liu et al. (2018) | |
| 1.02–6.17 | HPLC/DAD | Fresh weight | Topalovic and Mikulic-Petkovsek (2010) | |
| <50–350 | HPLC/DAD | Fresh weight | Nile et al. (2013) | |
| 50 | HPLC/DAD | Dry weight | Wongnarat and Srihanam (2017) | |
| Caffeic acid | nd | HPLC/PDA | Dry weight | Farhadi et al. (2016) |
| 0.301–1.488 | HPLC/DAD | Fresh weight | Liu et al. (2018) | |
| 100<<500 | HPLC/DAD | Fresh weight | Nile et al. (2013) | |
| 30–40 | HPLC/DAD | Dry weight | Wongnarat and Srihanam (2017) | |
| 7.72–162.78 | HPLC/PDA | Dry weight | Özcan et al. (2017) | |
| Rutin | 77–178 | HPLC/PDA | Dry weight | Farhadi et al. (2016) |
| 0.11–0.13 | UHPLC/DAD/MSMS | Frozen sample | Pantelic´ et al. (2016) | |
| 1.267–8.074 | HPLC/DAD | Fresh weight | Liu et al. (2018) | |
| Traces | HPLC/DAD | Palomino et al. (2000) | ||
| 2–10 | HPLC/DAD | Dry weight | Wongnarat and Srihanam (2017) | |
| 9.46–169.26 | HPLC/PDA | Dry weight | Özcan et al. (2017) | |
| Quercetin | 87–198 | HPLC/PDA | Dry weight | Farhadi et al. (2016) |
| nd | HPLC/DAD | Dry weight | Pantelic´ et al. (2016) | |
| nd | HPLC/DAD | Palomino et al. (2000) | ||
| 0.00 | HPLC/DAD | Dry weight | Marshall et al. (2012) | |
| <50–450 | HPLC/DAD | Fresh weight | Nile et al. (2013) | |
| 4 | HPLC/DAD | Dry weight | Wongnarat and Srihanam (2017) | |
| 35.65–131.37 | HPLC/PDA | Dry weight | Özcan et al. (2017) | |
| Protocatechuic acid | 0.08–0.12 | UHPLC/DAD/MSMS | Frozen sample | Pantelic´ et al. (2016) |
| 0.143–0.371 | HPLC/DAD | Fresh weight | Liu et al. (2018) | |
| Epigallocatechin gallate | 0.38–0.46 | UHPLC/DAD/MSMS | Frozen sample | Pantelic´ et al. (2016) |
| Myricetin | 0.00 | HPLC/DAD | Dry weight | Marshall et al. (2012) |
| 10 | HPLC/DAD | Dry weight | Wongnarat and Srihanam (2017) |
1Determination of total catechin content.
HPLC: high-performance liquid chromatography; UHPLC: ultra high-performance liquid chromatography; DAD: diode-array detection; PDA: photodiode array; QMS: quadrupole mass spectrometry; MS: mass spectrometry; QTOF: quadrupole time of flight; FD: fluorescence detection.
Table 4. Comparison of concentrations of selected analytes in grapevine stems according to studies.
| Analyte | Concentration (µg/g or µg/mL*) | Analytical method | Concentration in | Studies |
|---|---|---|---|---|
| Quercetin | >70 | HPLC/UV-VIS | Extract | Esparza et al. (2020) |
| 8–38 | HPLC/DAD | Dry weight | Jiménez-Moreno et al. (2019) | |
| 2–21 | HPLC/MS/MS | Dry weight | Anastasiadi et al. (2012) | |
| 13–108 | HPLC/DAD | Extract | Esparza et al. (2020) | |
| 120–140 | HPLC/DAD | Dry weight | Radovanovic´ et al. (2019) | |
| 0.041–0.215* | HPLC/DAD | Extract | Prusova et al. (2020) | |
| Gallic acid | >150 | HPLC/UV-VIS | Extract | Esparza et al. (2020) |
| 43–310 | HPLC/DAD | Dry weight | Jiménez-Moreno et al. (2019) | |
| 70–469 | HPLC/MS/MS | Dry weight | Anastasiadi et al. (2012) | |
| 10,500–11,500 | HPLC/UV-VIS | Residue | Silva et al. (2018) | |
| 32,960 | HPLC/DAD | Dry extract | Apostolou et al. (2013) | |
| 1,430–1,580 | HPLC/DAD | Dry weight | Radovanovic´ et al. (2019) | |
| 120–1,290 | HPLC/DAD | Extract | Esparza et al. (2020) | |
| 0.822–4.015 | HPLC/DAD | Extract | Prusova et al. (2020) | |
| Catechin | 225–710 | HPLC/DAD | Dry weight | Jiménez-Moreno et al. (2019) |
| 385–1,858 | HPLC/MS/MS | Dry weight | Anastasiadi et al. (2012) | |
| 900–3,500 | HPLC/DAD | Extract | Esparza et al. (2020) | |
| 29,300–38,700 | HPLC/UV-VIS | Residue | Silva et al. (2018) | |
| 157.57–1201.00 | HPLC/MS-QTOF | Dry weight | Boso et al. (2019) | |
| 2,310–2,550 | HPLC-DAD | Dry weight | Radovanovic´ et al. (2019) | |
| 18.398–78.930* | HPLC/DAD | Extract | Prusova et al. (2020) | |
| Epicatechin gallate | 12.3–189 | HPLC/MS/MS | Dry weight | Anastasiadi et al. (2012) |
| 1.742–33.589* | HPLC/DAD | Extract | Prusova et al. (2020) | |
| 7.04 | HPLC/MS-QTOF | Dry weight | Boso et al. (2019) | |
| 2,460–2,600 | HPLC/DAD | Dry weight | Radovanovic´ et al. (2019) | |
| 15,500 | HPLC/UV-VIS | Of residue | Silva et al. (2018) | |
| Resveratrol | 10–370 | HPLC/DAD | Extract | Esparza et al. (2020) |
| 74–266 | HPLC/MS/MS | Dry weight | Anastasiadi et al. (2012) | |
| >250 | HPLC/UV-VIS | Extract | Esparza et al. (2020) | |
| 21–162 | HPLC/DAD | Dry weight | Jiménez-Moreno et al. (2019) | |
| 2,150–25,410 | HPLC/UV-VIS | Dried extract | Sahpazidou et al. (2014) | |
| Quercetin-3-glucoside | 240–1,500 | HPLC/DAD | Extract | Esparza et al. (2021) |
| 54.1–137 | HPLC/MS/MS | Dry weight | Anastasiadi et al. (2012) | |
| >800 | HPLC/UV-VIS | Extract | Esparza et al. (2020) | |
| 96–485 | HPLC/DAD | Dry weight | Jiménez-Moreno et al. (2019) | |
| 1.783–11.158* | HPLC/DAD | Extract | Prusova et al. (2020) | |
| E-viniferin | 150–690 | HPLC/DAD | Extract | Esparza et al. (2021) |
| >500 | HPLC/UV-VIS | Extract | Esparza et al. (2020) | |
| 91–310 | HPLC/DAD | Dry weight | Jiménez-Moreno et al. (2019) | |
| 167–499 | HPLC/MS/MS | Dry weight | Anastasiadi et al. (2012) | |
| 170–760 | HPLC/DAD | Dry weight | Leal et al. (2020) |
HPLC: high-performance liquid chromatography; UHPLC: ultra high-performance liquid chromatography; DAD: diode-array detection; PDA: photodiode array; QMS: quadrupole mass spectrometry; MS: mass spec-trometry; QTOF: quadrupole time of flight; FD: fluorescence detection.
In Figures 2 and 3, we observe, as in Figure 1, large variability in the values of total polyphenols in both pulp and peels. This variability is probably due to, as in the case of total polyphenols in seeds, interference of the Folin method, different laboratory conditions and the the variety of grapes examined. However, we generally observe lower concentrations in pulp and peels than in seeds.
The most abundant polyphenols in peels and pulp and their extraction
Resveratrol
Silva et al. (2018) found high concentration of resveratrol in Preto Martinho and Touriga Nacional peel residues (4,700–8,400 μg/g). Charef et al. (2005) used supercritical fluid extraction for the Tinto Mazueleo, Cabernet, Boval, Merlot and Tempranillo varieties and obtained results in the range of 21.5–174 μg/g dw, with Tempranillo being the most concentrated sample. Iacopini et al. (2008) also examined different varieties and observed a similar range of concentration (6–255 μg/g dw). Farhadi et al. (2016) applied ultrasonic extraction with HCl and MeOH for the six varieties grown in West Azerbaijan, and determined concentrations of 9.2–29.8 μg/g dw. Pantelić et al. (2016) studied 13 grape varieties for the concentration of resveratrol. They obtained results in the range of 5.64–13.42 μg/g in frozen samples, and Procupac was the variety with the highest resveratrol content. Ni et al. (2017) gauged a 9.7 μg/g fw concentration from the skin of Kyoho grapes.
Rutin
Iacopini et al. (2008) reported relatively high concentration of rutin after a 4-h ethanol:water:HCl 0.12 M solution (ratio: 70:29:1, v/v/v) extraction from the Merlot, Sangiovese, Cabernet Sauvignon, Canaiolo, Colorino, Foglia Tonda and Montepulciano varieties (0.403–1.69 mg/g of dw). Farhadi et al. (2016) reported lower concentrations of rutin in dried grape seeds after ultrasonic extraction with methanol–HCl (99:1, v/v). Radovanović et al. (2019) reported even lower concentrations of rutin in the Merlot and Vranac varieties, also using ultrasonic extraction but with a different mixture. Supercritical fluid extraction is not effective for the extraction of rutin in the Tinto mozueleo, Cabernet, Boval, Merlot and Tempranillo varieties (Chafer et al., 2005). Pantelić et al. (2016) reported significantly different concentrations of rutin in the skins of 13 Serbian varieties (in the range of 0.88–38.97 μg/g of fw), with the highest concentration observed in the Sangiovese variety. Silva et al. (2018) reported concentration of rutin in the extract residues of the Preto Martinho (9.8 mg/g) and Touriga Nacional (27 mg/g) varieties.
Quercetin
Farhadi et al. (2016) studied concentration of quercetin in six different varieties, ranging from 306 to 405 μg/g dw, finding no major differences between them. Chafer et al. (2005) studied the Tinto mazueleo, Cabernet, Boval, Merlot and Tempranillo varieties, and discovered the highest concentration of quercetin in Merlot (254.7 μg/g dw) and the lowest in Cabernet (72.1 μg/g dw). Pantelić et al. (2016) found the highest concentration in Shiraz (121.94 μg/g fw) and the lowest in Chardonnay (0.57 μg/g fw), but overall there was no trend towards higher quercetin concentration in blue varieties. Samples of Merlot and Vranac skins were ultrasonically extracted for 1 h with 40 mL of solvent consisting of methanol: acetone:water:acetic acid (ratio: 30:42:27.5:0.5), with the concentration of 40 μg/g and 50 μg/g dw (Radovanović et al., 2019). Iacopini et al. (2008) studied polyphenols in red grapes and found quercetin concentration in the range of 2.9–10.07 μg/g dw.
Gallic acid
Radovanović et al. (2019) discovered similar concentrations of GA in the Merlot (1.36 mg/g dw) and Vranac (1.40 mg/g dw) varieties. Farhadi et al. (2016) reported GA concentration of 1.2 mg/g dw in different white varieties. Use of methanol:HCl solution (ratio: 99:1, v/v) for the extraction of GA did not lead to high concentrations of GA (0.122–0.319 mg/g dw) in different varieties (Muscat, Hosseini, Graha shira, Ag shani, Graha shani and Ghara ghandome). Moreover, Silva et al. (2018) observed relatively low concentrations of GA from extract residue in comparison with other analytes in Preto Martinho and Touriga Nacional. Pantelić et al. (2016) used methanol containing 0.1% HCl for extraction, reporting the concentration of GA in the range of 2.34–8.76 mg/kg of frozen samples, with the highest concentration discovered in the Cabernet Franc variety.
Epicatechin gallate
The highest concentration of epicatechin gallate was discovered in skin residue (12–23.5 mg/g). Water:ethanol solution (ratio: 50:50) was used for extraction (Silva et al., 2018). Dabetić et al. (2020) found a wide range of concentrations in 10 different varieties, from 32 to 5,219 μg/g dw, with the highest being in Cabernet Sauvignon. Despite the fact that Rusjan and Mikulic-Petkovsek (2017) calculated the concentration of the fresh weight of Merlot trigger, the authors arrived at relatively high values compared with other varieties, that is, 28–263 μg/g. Chafer et al. (2005) applied supercritical fluid extraction method to the Tinto Mazueleo, Cabernet, Boval, Merlot and Tempranillo varieties, and obtained results in the range of 91.5–233.6 μg/g dw, with Merlot having the highest concentration of epicatechin gallate, with the same as quercetin. Farhadi et al. (2016) also studied a larger number of samples for extraction; their results indicated that the lowest measured concentration corresponded to the highest measured concentration of the previous author, that is, 232 μg/g dw; their highest measured concentration was 482 μg/g dw. However, these results could be compared superficially only, because the sample treatment procedures differed. In their research, Boso et al. (2019) examined two Portuguese varieties, Albariño and Mencía, and measured concentrations of 1.26 μg/g and 4 μg/g dw by double extraction method. Pantelić et al. (2016) had a set of peels of 13 different varieties and obtained the results in the range of 2.95–3.65 μg/g (on a frozen weight basis), with a concentration of 3.65 μg/g fw for the Petra variety.
Catechin
Silva et al. (2018) extracted grape skin with a water:ethanol solution (ratio: 50:50) and determined concentration of catechin per 29.8–55.8 mg/g of residue. Radovanović et al. (2019) studied the Merlot and Vranac varieties and found concentrations of 1,890 μg/g and 2,020 μg/g dw by using ultrasonic extraction method. This type of extraction was also used by Farhadi et al. (2016), who assessed concentrations between 567–945 μg/g dw in five native grape cultivars of West Azerbaijan province. A comparable scope of concentrations was obtained by measurements made by Chafer et al. (2005; 536–897 μg/g dw), who used supercritical fluid extraction process. Dabetić et al. (2020) studied 10 grape varieties and found the highest concentration of catechin (307 μg/g dw) in the skin of Frankovka. Rusjan and Mikulic-Petkovsek (2017) studied double reasonable maturation and differences in grape composition, compared with the control, and found catechin concentration in the range of 48–178 μg/g fw. Pantelić et al. (2016) used extraction with methanol acidified with 0.1% HCl and obtained a result of 3.27–7.47 μg/g in frozen mass. Of the 13 varieties studied, Merlot had the highest catechin content. Boso et al. (2019) studied the Albariño and Mencía varieties using double extraction method (methanol/water/formic acid and acetone/water), and found concentrations of 4.83 μg/g and 19.65 μg/g dw.
Protocatechic acid
Teixeira et al. (2014) reported concentrations of protocatechic acid (1.5–2.4 µg/g fw) in the skins of red varieties of Vitis vinifera L. Pantelić et al. (2016) observed lower concentrations in the range of 0.4–0.55 µg/g fw, with the highest concentration in Sauvignon Blanc. Concentrations of protocatechic acid in the study conducted by Dabetić et al. (2020) were in a wide range of 65–1,663 µg/g dw, with the highest significant concentration found in the Začinak variety with ChCit extraction. Silva et al. (2018) reported a concentration of 7.2 mg/g in Preto Martinho and 2.3 mg/g in Touriga Nacional grape skin extract residues.
Myricetin
Radovanović et al. (2019) discovered myricetin GL in grape skin only in the concentration of 80–90 µg/g dw, but it was not observed in other grape wastes. Of the 13 varieties studied, myricetin was not discovered in the Chardonnay variety. Contrarily, the highest concentration was reported in the Sangiovese variety (46.64 µg/g fw) (Pantelić et al., 2016).
Epigallocatechin gallate was discovered in lower concentration in the range of 1.9–2.42 µg/g fw in 13 varieties studied (Pantelić et al., 2016).
Gallic acid
Compared with grape stems, skins and seed pulp are characterised by a small amount of polyphenols, often under the detection limit. Wongnarat and Srihanam (2017) used triple methanol extraction and discovered slightly higher concentration in white grape pulps. Özcan et al. (2017) observed GA as one of the most abundant polyphenols in grape pulps of the Razaki, Müşküle and Cardinal varieties. Farhadi et al. (2016) performed ultrasonic extraction of pulp polyphenols using hydrochloric acid in methanol as an extraction solvent, and discovered GA concentration ranging from 109 μg/g fw in the Muscat variety to 192 μg/g fw in the Ghara shani variety. Of the 30 analysed varieties, GA was found to be the most abundant polyphenolic compound in grape pulp, with the highest concentration discovered in the Pearl Black grape variety (2.262 μg/g fw) (Liu et al., 2018). Topalovic and Mikulic-Petkovsek (2010) analysed concentrations of GA in pulps using the maturation process, with peak concentration found in the earlier stages and constant values in the following maturation stages. Pantelić et al. (2016) confirmed the high levels of GA in the pulp of different grape varieties, with the highest concentration in the Pinot Noir variety (0.74 μg/g fw).
Resveratrol
As reported by different studies, the concentration of resveratrol in grape pulp is a compound balanced around discovered limit values. Resveratrol was not found in the selected white and blue varieties (Wongnarat and Srihanam, 2017). Palomino et al. (2000) discovered only traces of this compound, and Ni et al. (2017) noticed a concentration of <0.1 μg/g fw in the Kyoho grape variety. Marshall et al. (2012) discovered a concentration of 4.29 μg/g dw in the Janet variety, but resveratrol was not found in the majority of varieties examined. Farhadi et al. (2016) measured concentrations in the range of 9.2–28.7 μg/g dw using ultrasonic extraction, and Özcan et al. (2017) reported concentrations between 11.14–39.75 μg/g dw, with the highest concentration in the Razaki variety.
Catechin
As in the case of other analytes, high concentrations of catechin were observed after ultrasonic extraction, the highest in the Ghara shani variety (514 μg/g dw) (Farhadi et al., 2016). Özcan et al. (2017) observed significantly different concentrations of catechin in grape pulp differing in variety and harvest time. Wongnarat and Srihanam (2017) found similar concentrations between white and blue varieties in the range of 70–80 μg/g dw. Topalovic and Mikulic-Petkovsek (2010) observed concentrations in the range of 2.39–3.74 μg/g fw during different stages of ripening. Ivanova et al. (2010) reported concentrations of total catechin using the spectrometric method, extracting twice for 15 min with 10-mL acetone: water solution (ratio: 80:20, v/v) containing HCl (ratio: 0.1:10, v/v).
Epicatechin gallate
Nile et al. (2013) studied epicatechin gallate in 20 grape cultivars, and the range of concentration determined was around 50–350 μg/g in the lyophilised sample. Of the six examined varieties, epicatechin gallate was less abundant than catechin, with the highest concentration in the Ghara shani variety (234 μg/g dw; Farhadi et al., 2016). Wongnarat and Srihanam (2017) discovered the same concentration of 50 μg/g dw in both white and blue varieties using the triple methanol extraction method. Of the 30 varieties examined, the highest concentration of epicatechin gallate was found in the black grape variety, that is, 2.464 μg/g fw (Liu et al., 2018). Topalovic and Mikulic-Petkovsek (2010) also found micrograms of epicatechin gallate in 1 g of fresh sample and observed significantly increased synthesis of epicatechin gallate in samples collected in the early stages of ripening. Pantelić et al. (2016) did not discover epicatechin gallate in the pulp because either it was not present or was at a concentration below the detection limit.
Rutin
Liu et al. (2018) used ultrasonication to gain pulp extracts and measure rutin in six varieties, with results in the range of 77–178 μg/g dw. Özcan et al. (2017) extracted rutin with a mixture of methanol, water and formic acid from three varieties, and discovered its concentration between 9.46 μg/g and 169.26 μg/g dw, with the highest concentration in the Razaki variety. Surprisingly, Wongnarat and Srihanam (2017), and Liu et al. (2018) discovered similar concentrations. Wongnarat and Srihanam (2017), who studied one white and one blue variety and used triple extraction method, discovered a concentration of 2–10 μg/g dw. Liu et al. (2018) converted the concentration of this analyte to frozen weight and accessed a concentration of 1.267–8.074 μg/g, also using three extractions. Pantelić et al. (2016) assessed a narrow range of concentrations of 0.11–0.13 μg/g fw in 13 varieties (Cabernet Sauvignon, Merlot, Cabernet Franc, Sangiovese, Shiraz, Pinot Noir, Prokupac, Riesling, Petra, Sauvignon Blanc, Welschriesling, Chardonnay and Pinot Gris). Trace amount of rutin in grape flesh was found by Palomino et al. (2000).
Quercetin
Nile et al. (2013) studied 20 grape cultivars for quercetin concentration, and the range was less than 50–450 μg/g of lyophilised sample. Farhadi et al. (2016) measured quercetin in the pulp of five native West Azerbaijan varieties and one international variety (Muscat Alexandera), with the results ranging from 87 to 198 μg/g dw. The highest value was found in the Ghara Shira variety. As mentioned above, the authors used ultrasonic extraction. Özcan et al. (2017) studied the effect of harvest time on physicochemical properties and bioactive compounds, and in the case of rutin discovered the range of 35.65–131.37 μg/g dw in the pulp of three different varieties. The concentration of 4 μg/g dw was found in the white variety by Wongnarat and Srihanam (2017). The authors used the triple extraction of pulp from one red and one white variety. Quercetin was not observed in the pulp of the red variety because it was either not present in this variety or its concentration was under the detection limit. The same reasons could have led to the results reported by other studies (Marshall et al., 2012; Palomino et al., 2000; Pantelic et al., 2016).
Liu et al. (2018) studied 30 different grape varieties and discovered protocatechuic acid in 11 samples in the range of 0.143–0.371 μg/g fw. The authors used six-fold extraction. The first two extractions were carried out with tetrahydrofuran. The residue was mixed with acidified methanol for two times. The residue was then hydrolysed, and fatty acids were removed with n-hexane. The remainder was extracted twice with a 5-mL mixture of diethyl ether and ethyl acetate.
Pantelić et al. (2016) used a slightly simpler extraction method, a triple extraction with methanol acidified with HCl. Their results appeared to be lower than the results of Liu et al. (2018), but this was not stated with certainty because they related the concentration to the weight of the frozen sample. In 13 varieties studied, Pantelić et al. (2016) measured protocatechuic acid in the range of 0.08–0.12 μg/g. The highest value belonged to Cabernet Franc. The authors also measured epigallocatechin gallate (0.38–0.46 μg/g in the frozen sample), with the highest value being for the Petra variety; myricetin was not detected in any of the studied varieties. Marshall et al. (2012) also did not find myricetin in several clones of muscadines. Wongnarat and Srihanam (2017), who used triple methanol extraction, observed 10 μg/g dw of myricetin.
Polyphenols in stems—characteristics, distribution and effect on health
Grape stems represent 1.4–7.0% of the raw material and 25% of the winemaking by-products, and polyphenols represent 5.8% of dry weight. The grape stem is defined by the abundance of crude fibre and protein, nitrogen-free extracts and antioxidant properties.
Water content in grape stems varies in the range of 55–80%, depending on the grape variety, and the dry matter contains 71% of alcohol-insoluble residues. No differences were reported between red and white varieties (González-Centeno et al., 2012; Prusova et al., 2020).
Polyphenols content was studied in grape seeds, skins, must and wines. Polyphenols are stored in every part, including stems, except the berry. However, many studies have proved that stem extract contains lower amount of polyphenols and showed lower antioxidant activity, compared with the other parts of the vine (Castillo-Muñoz et al., 2007; Gonzalez-Centeno et al., 2012; Nassiri-Asl and Hosseinzadeh, 2016).
Wenzel et al. (2015) observed higher TPC, expressed as the amount of GA per dry sample, and related antioxidant activity in seed extracts in comparison with stem and peel extracts, compared with the study conducted by Hanušovský et al. (2020). Hanušovský et al. (2020) studied samples of three varieties—Zweigelt red-skinned, Pinot Blanc white-skinned and Green Veltliner white-skinned, obtained from six different locations (Nitra and Vienna wine regions). It was discovered that stem TPC was higher than that of other parts of a bunch or the grape pomace in samples from both regions. Also, grape stem extracts possessed the highest antioxidant activity. In addition, a higher abundance of lignin increased this property.
The steam also confirmed the influence of different grape varieties as well as extraction methods on TPC along with the effect of temperature on extraction (Hanušovský et al., 2020; Wenzel et al., 2015). The study conducted on flavanol content in the Albariño variety showed the greatest abundance of flavanols in bunch stems, with lower quantity in grape peels, must and wine. In the stem bunch, analyses confirmed catechin as the dominant flavanol and high concentration of procyanidin B1 and its derivates (Boso et al., 2019). This observation correlates with the results of Püssa et al. (2006), who observed a significantly higher content of polyphenols in bunch stems of red grapes, compared with white varieties. Moreover, the analysis also determined higher content in anthocyanins in the bunch stems of red varieties.
On the other hand, a study conducted by Gonzalez-Centeno et al. (2012) on the bunch stems of red (Cabernet Sauvignon, Callet, Manto Negro, Syrah and Tempranillo) and white (Chardonnay, Macabeu, Parellada and Prebsal Blanc) varieties did not show typical differences in flavanol content. Therefore, it could be argued that TPC is affected more by other factors than the classification of grapes being white or red. This needs to be supported by the studies observing different cultivating factors on the same varieties (Boso et al., 2019). The study on the composition of polyphenols in grape stems showed high levels of flavan-3-ols, hydroxycinnamic acids, flavonols (monomeric and oligomeric) and stilbenes (Cao and Ito, 2003; Karvela et al., 2009). (An Investigation on Factors Affecting Recovery of Antioxidant Phenolics and Anthocyanins from Red Grape). Several studies confirmed trans-caftaric acid as the phenol with highest concentration in both white and red varieties (Anastasiadi et al., 2012; Apostolou et al., 2013).
The analysis of flavanols in the stems of red varieties showed the presence of diverse flavonols, with a high abundance of quercetin derivatives and the highest content of quercetin-3-O-glucuronide (Negro et al., 2003; Souquet et al., 2000). In addition, quercetin-3-O-glucoside, quercetin-3-O-galactoside and quercetin-3-O-rutinoside were the most abundantly discovered flavanols (Apostolou et al., 2013; Souquet et al., 2000). Comparison of red and white variety stems showed similar characterisation of flavanols, but with much higher flavanol content in red varieties.
Catechin is the most abundant of all the flavan-3-ols, in both white and red varieties, with the highest concentration in grape stems, followed by skins and seeds. Within white varieties, the analysis also showed that catechins are the most concentrated flavan-3-ols in all tissues, with the highest quantity found in grape stems.
Analysis of stilbenes in grape residues from red varieties confirmed the presence of their derivatives in stems, seeds, pomaces and leaves. Contrarily, stilbenes have been found only in skins and stems in white varieties (Anastasiadi et al., 2012; Apostolou et al., 2013; Di Lecce et al., 2014; Rockenbach et al., 2011).
Nowadays, grape stems as a winemaking by-product often represent undervalued material and a waste, a problem for the environment. The rich content of bioactive compounds potentiates grape stems as a prospective material for the introduction of added-value products.
Grape stems are widely used for the production of alcoholic beverages, dietary fibre, plant protein supplements, animal feed and fertilisers (Arvanitoyannis et al., 2006), but bioactive compositions remain poorly defined. The transformation of agro-food wastes into products with added value has caught the attention of the food and pharmaceutical sectors (Martins et al., 2011). Owing to the presence of proanthocyanidins, grape stems and grape clusters are a source of compounds causing excessive astringent taste and influencing organoleptic properties of wine. Therefore, they are removed before the vinification process, but the usage of this waste is being discussed intensively.
The usage of grape waste as a material source for food production could lead to a replacement of intake of synthetic antioxidants with adverse effects. However, bioactive compounds contained in the vine and their impact on the human and animal health has to be investigated in detail.
The chemical composition of grape stems, along with grape variety and growing conditions, strongly influence extraction processes. Domínguez-Perles et al. (2014) compared the conditions to increase the effectiveness of phenol extraction as determined by response surface methodology. Performing experiments on grape stems of Greek varieties, lower extraction temperature led to a 34% increase in extracted phenols.
Compared with pomace and the whole bunch, ABTS showed significantly higher (p < 0.01) antioxidant activity in grape stems. On the other hand, in Slovak samples, DPPH assay did not show significant differences in the antioxidant activities of grape by-products.
In Slovakia and Austria, grape stems had significantly fewer (p < 0.01) proteins in comparison with grape pomace and bunch. Compared with grape pomace and bunch, TPC analysis showed significantly (p < 0.01) higher content of grape stem in the samples of both countries. The comparison of Slovak and Austrian wine by-products was characterised by similar nutrition content, condensed tannins and TPC as well as antioxidant activity.
Gouvinhas et al. (2020) described the effect of climate and altitude on the production of phenols in grape stems. The authors discovered increased numbers of phenols, orthodiphenols and flavonoids in the grape stems cultivated in low altitude areas (Lower Corgo sub-region). This region is characterised by stressful vine conditions and represented by heavy rains caused by the Atlantic Ocean and thermal stress. Plants respond to stress by synthesising secondary metabolites, including phenols. The impact of thermal stress on these metabolites in the vine was evident during the 2017 and 2018 seasons. The results demonstrated that altitude was a determining factor for the content of polyphenolics.
Though fluctuating levels of phenols in stems were observed, this by-product is a potential source of phenols. Moreover, as in grape seed extracts, antimicrobial activity was observed in grape stem extracts against gastrointestinal tract bacteria S. aureus and E. faecalis. Additionally, Anastasiadi et al. (2012) described the antimicrobial activity of grape extracts caused by the high abundance of flavonoids, phenolic acids and stilbenes in stems along with flavonoids and their derivatives in seeds.
This graph visually shows the least heterogeneous results in terms of percentage values. The rationale could be that the amount of phenolic compounds in the trefoil is least burdened by grapevine species. However, as mentioned above, the Folin method is highly burdened by interference, so we cannot prove this claim. Moreover, there are still noticeable differences over 100 mg/g.
The most abundant polyphenols in grape stems and their effect on health
Gallic acid
The highest amount of GA in grape stems was reported by Apostolou et al. (2013), that is, 32,960 µg/g of dry extract. The Mazuelo variety was studied by Jiménez-Moreno et al. (2019), whose results were in the range of 43–310 µg/g dw. They used solvent extraction with five levels of ethanol concentration, two ratios of solid and solvent, and two levels of extraction temperature. This could be the reason for the high scatter of results. GA in Mazuelo stem extracts was also studied by Esparza et al. (2020). The authors showed the result of a measured concentration higher than 150 µg/mg, which matched their results of 120–1,290 µg/g of extract from different Spanish varieties, including Mazuelo (Esparza et al., 2020). Ordinarily, the same results were measured in Mandilaria, Mavrotragano, Voidomatis, Asyrtiko, Athiri and Aidani in the range 70–469 µg/g dw. Quite higher results were discovered by Radovanović et al. (2019) using extraction with MeOH/H2O/HCl (1,430–1,580 µg/g dw) and Anastasiadi et al. (2012) (10.5–11.5 mg/g of residue).
The lowest concentration of 0.822–4.005 µg/mL of extract was measured by Prusova et al. (2020). The reason for different results could be the extraction method. Moreover, Prusova et al (2020) worked with fresh material. As mentioned above, stems contain up to 80% water. Low concentration of GA in the range of 0.013–0.024 µg/g dw in grape stems was discovered by Teixeira et al. (2018).
Esparza et al. (2020) reported a quercetin concentration of >0.07 µg/mL of extract from dried powdered stems, and observed the impact of light and temperature on the stability of phenolic compounds during storage. Prusova et al. (2020) measured a concentration of 0.041–0.215 µg/mL of quercetin extract from fresh stems of 10–12-year-old vines. Relatively small concentrations were due to its calculation of analyte in diluted stem extract. Contrarily, Radovanović et al. (2019) Anastasiadi et al. (2012) and Jiménez-Moreno et al. (2019) reported quercetin concentrations of 8–38 µg/g, 2–21 µg/g and 120–140 µg/g of dw, respectively, and the highest concentrations were observed in the Merlot and Vranac varieties. Vines were cultured in Serbia, and dried, milled, and phenols were extracted using ultrasound-assisted extraction with a mixture of methanol:acetone: water:acetic acid (ratio: 30:42:27.5:0.5) (Radovanović et al., 2019).
Catechin
The highest catechin concentration was measured by Silva et al. (2018) in dry extract residue (29.3–38.7 mg/g). Catechin concentration was measured by Anastasiadi et al. (2012; 385–1,858 µg/g), Karvela et al. (2009; 900–3,500 µg/g), Radovanović (2019; 2,310–2,550 µg/g) and Boso et al. (2019; 1,201 µg/g). The extraction method and solvent used differed depending on the study. For example, a mixture of methanol, water and some organic acid was applied, or a mixture of ethanol and water. Boso et al. (2019) used a two-step extraction method, but their results were still comparable with others (1,201 µg/g of catechin in stems from red variety). However, Boso et al. (2019) had measured a concentration of 157.57 µg/g dw in the stems of the white variety. Close to this value were the results of Jiménez-Moreno et al. (2019), who used different ethanol concentrations for extraction and found results in the range from 225–710 µg/g dw. Considering these results, we concluded that the extraction method was not a strong factor in the comparison of results. The lowest concentration was found by Prusova et al. (2020) in fresh weight.
Epicatechin gallate
The highest concentration of epicatechin gallate was determined by Silva et al. (2018; 15.5 mg/g), possibly because of assessing extract residue. This was followed by an epicatechin gallate concentration of 2.6 mg/g by Radovanović et al. (2019); these authors used ultrasonic extraction with a solvent consisting of methanol, acetone, water and acetic acid. The respective concentration of epicatechin gallate discovered by Boso et al. (2019), Prusova et al. (2020), and Anastasiadi et al. (2012) was 12.3–189 µg/g dw, 1.742–33.589 mg/L of extract and 7.04 µg/g dw.
Resveratrol
Anastasiadi et al. (2012) and Jiménez-Moreno et al. (2019) reported the concentration of resveratrol as 74–266 µg/g and 21–162 µg/g dw, respectively. Jiménez-Moreno et al. (2019) investigated the influence of three process parameters on extraction: ethanol concentration, extraction temperature and solid/solvent ratio, observing a wide variety of results of all analytes. The most effective extraction used 50% ethanol as solvent, a temperature of 40°C and a 1:50 solid/solvent ratio. Esparza et al. (2020, 2021) analysed the concentration of resveratrol directly from grape stem extract with comparable results. Comparing the Assyrtiko, Mavrotragano, Voidomato and Muscat varieties, Sahpazidou et al. (2014) reported the lowest concentration in the white variety Assyrtiko (2,150 µg/g of extract), and the highest abundance in the red variety Voidomato (25,410 µg/g of extract).
E-viniferin
In contrast with other analytes, the value of Ε-viniferin was found to be the same throughout different studies (Esparza et al., 2020, 2021; Jiménez-Moreno et al., 2019). Analysing dry weight, the abundance of Ε-viniferin was in the range of 91 µg/g dw of stem powder of the Mazuleo variety to 310 µg/g dw using different extraction methods (Jiménez-Moreno et al., 2019). Esparza et al. (2020) analysed the abundance of E-viniferin in stem extract, which showed a relatively high concentration of viniferin and its susceptibility to light exposition and higher temperatures (25°C and 40°C). However, according to Esparza et al. (2021), the concentration of viniferin was in the range of 150 µg/g for the Tempranillo variety (vintage 2018) extract to 690 µg/g for the Mazuleo variety.
Quercetin-3-glucoside
Among stem extracts, the highest concentration of quercetin-3-glucoside was observed in a vintage 2018 Mazuleo variety (1.5 mg/g) by Esparza et al. (2021). The high abundance was in correlation with their earlier study (Esparza et al., 2020), where they found the concentration of >800 µg/g. The most effective extraction of quercetin-3-glucoside was achieved using 50% ethanol as a solvent, an extraction temperature of 40°C and a solid/solvent ratio (w/v) of 1:50 (Esparza et al., 2020).
Conclusion
Phenolic compounds are secondary metabolites of plants; accordingly, these are not necessary for plant growth and development but are essential for plant survival. Phenolic compounds play an important role in photosynthesis, respiration, and plant defence, among others. In recent years, interest in the detailed study of phenolic compounds has increased, mainly because of their positive effects on human health. Their presence in grapes has already been proved by many studies. However, the reported concentrations of total and individual polyphenols vary widely. It depends on the way the sample is treated, the method used, the detector used, and the calculation to dry or fresh matter.
By comparing the determined values of selected analytes from different parts of grapevine, a large variability in individual results of different studies was observed. Therefore, it was concluded that the concentration determined not only depended on the choice of variety and the site of growing habitat of the plant but also on the choice of extraction conditions, analytical methods and laboratory conditions. The most commonly used technique is the extraction method with mixtures of organic solvents and water. The mixtures used are adjusted according to the desired polarity. The most common analytical method used is HPLC, or its variations with mass and spectrophotometric detectors or combinations thereof.
We were not able to determine the phenolic substance that was concentrated in each part of the plant, because individual studies provided these concentrations based on their measurements. However, we were able to determine the most studied analytes. We observed variations in the determination of total polyphenolic compounds in Figures 1–4. These variations could be due to the use of different solvents or the strong influence of interferences, such as carbohydrates, in the method used. However, it is clear that the higher proportion of phenolic compounds is found in seeds and stems, compared with lower proportions in the fruit peel. In general, the pulp of the berry contains the least proportion of phenolic compounds.
Funding
This paper was supported by the project “Study of polyphenolics compounds in wines and parts vines” IGA-ZF/2021-SI2009, and by CZ.02.1.01/0.0/0.0/l6_0l7/0002334 Research Infrastructure for Young Scientists, co-financed by Operational Programme Research, Development and Education.
REFERENCES
Abarghuei, M.J., Rouzbehan, Y. and Alipour, D. 2010. The influence of the grape pomace on the ruminal parameters of sheep. Livest Sci. 132(1–3): 73–79. 10.1016/j.livsci.2010.05.002
Anastasiadi, M., Pratsinis, H., Kletsas, D., Skaltsounis, A.-L. and Haroutounian, S.A. 2012. Grape stem extracts: polyphenolic content and assessment of their in vitro antioxidant properties. Food Sci Tech (LWT). 48(2): 316–322. 10.1016/j.lwt.2012.04.006
Apostolou, A., Stagos, D., Galitsiou, E., Spyrou, A., Haroutounian, S., Portesis, N., et al. 2013. Assessment of polyphenolic content, antioxidant activity, protection against ROS-induced DNA damage and anticancer activity of Vitis vinifera stem extracts. Food Chem Toxicol. 61: 60–68. 10.1016/j.fct.2013.01.029
Arvanitoyannis, I.S., Ladas, D. and Mavromatis, A. 2006. Potential uses and applications of treated wine waste: a review. Int J Food Sci Tech. 41(5): 475–487. 10.1111/j.1365-2621.2005.01111.x
Assumpção, C.F., Nunes, I.L., Mendonça, T.A., Bortolin, R.C., Jablonski, A., Flôres, S.H. et al. 2016. Bioactive compounds and stability of organic and conventional Vitis labrusca grape seed oils. J Am Oil Chem Soc. 93(1): 115–124. 10.1007/s11746-015-2742-0
Aybastier, O., Dawbaa, S. and Demir, C. 2018. Investigation of antioxidant ability of grape seeds extract to prevent oxidatively induced DNA damage by gas chromatography-tandem mass spectrometry. J Chromatogr B Anal Tech Biomed Life Sci. 1072, 328–335. 10.1016/j.jchromb.2017.11.044
Bagchi, D., Bagchi, M., Stohs, S.J., Das, D.K., Ray, S.D., Kuszynski, C.A., et al. 2000. Free radicals and grape seed proanthocyanidin extract: importance in human health and disease prevention. Toxicology. 148(2–3): 187–197. 10.1016/S0300-483X(00)00210-9
Baiano, A. and Terracone, C. 2012. Effects of bud load on quality of Beogradska besemena and Thompson seedless table grapes and cultivar differentiation based on chemometrics of analytical indices. J Sc Food Agri. 92(3): 645–653. 10.1002/jsfa.4625
Balu, M., Sangeetha, P., Murali, G. and Panneerselvam, C. 2006. Modulatory role of grape seed extract on age-related oxidative DNA damage in central nervous system of rats. Brain Res Bull. 68(6): 469–473. 10.1016/j.brainresbull.2005.10.007
Boso, S., Gago, P., Santiago, J.L., Álvarez-Acero, I. and Martínez, M.d.C. 2019. Concentration of Flavanols in red and white winemaking wastes (grape skins, seeds and bunch stems), musts, and final wines. Erwerbs Obstbau. 61(1): 75–84. 10.1007/s10341-019-00455-z
Brenes, A., Viveros, A., Chamorro, S. and Arija, I. 2016. Use of polyphenol-rich grape by-products in monogastric nutrition. a review. Anim Feed Sci Tech. 211, 1–17. 10.1016/j.anifeedsci.2015.09.016
Bucić-Kojić, A., Planinić, M., Tomas, S., Jakobek, L. and Šeruga, M. 2009. Influence of solvent and temperature on extraction of phenolic compounds from grape seed, antioxidant activity and colour of extract. Int J Food Sci Tech. 44(12): 2394–2401. 10.1111/j.1365-2621.2008.01876.x
Butterfield, D.A., Castegna, A., Lauderback, C.M. and Drake, J. 2002. Evidence that amyloid beta-peptide-induced lipid peroxidation and its sequelae in Alzheimer’s disease brain contribute to neuronal death. Neurobiol Aging. 23(5): 655–664. 10.1016/s0197-4580(01)00340-2.
Cadot, Y., Miñana-Castelló, M.T. and Chevalier, M. 2006. Anatomical, histological, and histochemical changes in grape seeds from Vitis vinifera L. cv Cabernet franc during fruit development. J Agric Food Chem. 54(24): 9206–9215. 10.1021/jf061326f
Cao, X. and Ito, Y. 2003. Supercritical fluid extraction of grape seed oil and subsequent separation of free fatty acids by high-speed counter-current chromatography. J Chromatogr A. 1021(1–2): 117–124. 10.1016/j.chroma.2003.09.001
Castillo-Muñoz, N., Gómez-Alonso, S., García-Romero, E. and Hermosín-Gutiérrez, I. 2007. Flavonol profiles of Vitis vinifera red grapes and their single-cultivar wines. J Agric Food Chem. 55(3): 992–1002. 10.1021/jf062800k
Castro-Lopez, L., Castillo-Sanchez, G., Díaz-Rubio, L. and Cordova-Guerrero, I. 2019. Total content of phenols and antioxidant activity of grape skins and seeds cabernet sauvignon cultivated in Valle de Guadalupe, Baja California, México. BIO Web Conf. 10.1051/bioconf/20191504001
Chafer, A., Pascual-Marti, M.C., Salvador, A. and Berna, A. 2005. Supercritical fluid extraction and HPLC determination of relevant polyphenolic compounds in grape skin. J Sep Sci. 28(16): 2050–2056. 10.1002/jssc.200500128
Chamorro, S., Goñi, I., Viveros, A., Hervert-Hernández, D. and Brenes, A. 2012. Changes in polyphenolic content and antioxidant activity after thermal treatments of grape seed extract and grape pomace. Eur Food Res Technol. 234(1): 147–155. 10.1007/s00217-011-1621-7
Chamorro, S., Viveros, A., Rebolé, A., Rica, B.D., Arija, I. and Brenes, A. 2015. Influence of dietary enzyme addition on polyphenol utilization and meat lipid oxidation of chicks fed grape pomace. Food Res Int. 73: 197–203. 10.1016/j.foodres.2014.11.054
Cheng, V.J., Bekhit, A.E.-D.A., McConnell, M., Mros, S. and Zhao, J. 2012. Effect of extraction solvent, waste fraction and grape variety on the antimicrobial and antioxidant activities of extracts from wine residue from cool climate. Food Chem. 134(1): 474–482. 10.1016/j.foodchem.2012.02.103
Chorti, E., Kyraleou, M., Kallithraka, S., Pavlidis, M., Koundouras, S. and Kotseridis, Y. 2016. Irrigation and leaf removal effects on polyphenolic content of grapes and wines produced from cv. “Agiorgitiko” (Vitis vinifera L.). Notulae Botanicae Horti Agrobotanic Cluj-Napoca. 44(1): 133–139. 10.15835/nbha44110254
Colibaba, L.C., Cotea, V.V., Rotaru, L., Nechita, B., Niculaua, M., Tudose-Sandu-Ville, S., et al. 2015. Volatiles in Tămâioasă Românească via supercritical fluid extraction (SFE) analysis. Environ Eng Manag J (EEMJ). 14(2): 29. 10.30638/eemj.2015.029
Cook, N.C. and Samman, S. 1996. Flavonoids—chemistry, metabolism, cardioprotective effects, and dietary sources. J Nutr Biochem. 7(2): 66–76. 10.1016/0955-2863(95)00168-9
Cotea, V.V., Luchian, C., Niculaua, M., Zamfir, C.I., Moraru, I., Nechita, B.C., et al. 2018. Evaluation of phenolic compounds content in grape seeds. Environ Eng Manag J (EEMJ). 17(4): 795–803. 10.30638/eemj.2018.080
Crozier, A., Clifford, M.N. and Ashihara, H. 2008. Plant Secondary Metabolites: Occurrence, Structure and Role in the Human Diet. Hoboken, NJ: John Wiley.
Dabetić, N., Todorović, V., Panić, M., Radojčić Redovniković, I. and Šobajić, S. 2020. Impact of deep eutectic solvents on extraction of polyphenols from grape seeds and skin. Appl Sci. 10(14): 4830. 10.3390/app10144830
de Campos, L.M., Leimann, F.V., Pedrosa, R.C. and Ferreira, S.R. 2008. Free radical scavenging of grape pomace extracts from Cabernet sauvingnon (Vitis vinifera). Bioresour Technol. 99(17): 8413–8420. 10.1016/j.biortech.2008.02.058
de la Cerda-Carrasco, A., Lopez-Solis, R., Nunez-Kalasic, H., Pena-Neira, A. and Obreque-Slier, E. 2015. Phenolic composition and antioxidant capacity of pomaces from four grape varieties (Vitis vinifera L.). J Sci Food Agric. 95(7): 1521–1527. 10.1002/jsfa.6856
Di Lecce, G., Arranz, S., Jauregui, O., Tresserra-Rimbau, A., Quifer-Rada, P. and Lamuela-Raventos, R.M. 2014. Phenolic profiling of the skin, pulp and seeds of Albarino grapes using hybrid quadrupole time-of-flight and triple-quadrupole mass spectrometry. Food Chem. 145: 874–882. 10.1016/j.foodchem.2013.08.115
Di Lorenzo, C., Colombo, F., Biella, S., Stockley, C. and Restani, P. 2021. Polyphenols and human health: the role of bioavailability. Nutrients. 13(1): 273. 10.3390/nu13010273
Dinis, L.-T., Bernardo, S., Matos, C., Malheiro, A., Flores, R., Alves, S., et al. 2020. Overview of kaolin outcomes from vine to wine: cerceal white variety case study. Agronomy, 10(9): 1422. 10.3390/agronomy10091422
Dohadwala, M.M. and Vita, J.A. 2009. Grapes and cardiovascular disease. J Nutr. 139(9): 1788S–1793S. 10.3945/jn.109.107474
Domínguez-Perles, R., Teixeira, A., Rosa, E. and Barros, A. 2014. Assessment of (poly)phenols in grape (Vitis vinifera L.) stems by using food/pharma industry compatible solvents and response surface methodology. Food Chem. 164: 339–346. 10.1016/j.foodchem.2014.05.020
Downey, M.O., Harvey, J.S. and Robinson, S.P. 2003. Analysis of tannins in seeds and skins of Shiraz grapes throughout berry development. Aust J Grape Wine Res. 9(1): 15–27. 10.1111/j.1755-0238.2003.tb00228.x
Dwyer, K., Hosseinian, F. and Rod, M.R. 2014. The market potential of grape waste alternatives. J Food Res. 3(2): 91–106. 10.5539/jfr.v3n2p91
Eleonora, N., Dobrei, A., Alina, D., Bampidis, V. and Valeria, C. 2014. Grape pomace in sheep and dairy cows feeding. J Hortic Forestry Biotechnol. 18(2): 146–150.
Esparza, I., Cimminelli, M.J., Moler, J.A., Jimenez-Moreno, N. and Ancin-Azpilicueta, C. 2020. Stability of phenolic compounds in grape stem extracts. Antioxidants (Basel). 9(8): 720. 10.3390/antiox9080720
Esparza, I., Moler, J.A., Arteta, M., Jimenez-Moreno, N. and Ancin-Azpilicueta, C. 2021. Phenolic composition of grape stems from different Spanish varieties and vintages. Biomolecules. 11(8): 1221. 10.3390/biom11081221
Farhadi, K., Esmaeilzadeh, F., Hatami, M., Forough, M. and Molaie, R. 2016. Determination of phenolic compounds content and antioxidant activity in skin, pulp, seed, cane and leaf of five native grape cultivars in West Azerbaijan province, Iran. Food Chem. 199: 847–855. 10.1016/j.foodchem.2015.12.083
Feng, Y., Liu, Y.M., Fratkins, J.D. and LeBlanc, M.H. 2005. Grape seed extract suppresses lipid peroxidation and reduces hypoxic ischemic brain injury in neonatal rats. Brain Res Bull. 66(2): 120–127. 10.1016/j.brainresbull.2005.04.006
Fernandes, L., Casal, S., Cruz, R., Pereira, J.A. and Ramalhosa, E. 2013. Seed oils of ten traditional Portuguese grape varieties with interesting chemical and antioxidant properties. Food Res Int. 50(1): 161–166. 10.1016/j.foodres.2012.09.039
Ferreira, W.M., Fraga, M. and Carabañco, R. 1996. Inclusion of grape pomace, in substitution for alfalfa hay, in diets for growing rabbits. Anim Sci. 63(1): 167–174. 10.1017/S135772980002840X
Fiesel, A., Gessner, D.K., Most, E. and Eder, K. 2014. Effects of dietary polyphenol-rich plant products from grape or hop on pro-inflammatory gene expression in the intestine, nutrient digestibility and faecal microbiota of weaned pigs. BMC Vet Res. 10(1): 1–11. 10.1186/s12917-014-0196-5
Freitas, V.A.P.D. and Glories, Y. 1999. Concentration and compositional changes of procyanidins in grape seeds and skin of white Vitis vinifera varieties. J Sci Food Agric. 79(12): 1601–1606. 10.1002/(SICI)1097-0010(199909)79:12<1601::AID-JSFA407>3.0.CO;2-1
Garavaglia, J., Markoski, M.M., Oliveira, A. and Marcadenti, A. 2016. Grape seed oil compounds: biological and chemical actions for health. Nutr Metab Insights. 9: 59–64. 10.4137/NMI.S32910
Georgiev, V., Ananga, A. and Tsolova, V. 2014. Recent advances and uses of grape flavonoids as nutraceuticals. Nutrients. 6(1): 391–415. 10.3390/nu6010391
Gierus, M., Slama, J.A., Puntigam, R., Philipp, C., Zábranský, L., Rolinec, M., et al. 2020. The nutritional potential of grape by-products from the area of Slovakia and Austria. Emirates J Food Agric. 10.9755/ejfa.2020.v32.i1.2051
Gonzalez-Centeno, M.R., Jourdes, M., Femenia, A., Simal, S., Rossello, C. and Teissedre, P.L. 2012. Proanthocyanidin composition and antioxidant potential of the stem winemaking byproducts from 10 different grape varieties (Vitis vinifera L.). J Agric Food Chem. 60(48): 11850–11858. 10.1021/jf303047k
González-Centeno, M.R., Rosselló, C., Simal, S., Garau, M.C., López, F. and Femenia, A. 2010. Physico-chemical properties of cell wall materials obtained from ten grape varieties and their byproducts: grape pomaces and stems. Food Sci Tech (LWT). 43(10): 1580–1586. 10.1016/j.lwt.2010.06.024
Gouvinhas, I., Pinto, R., Santos, R., Saavedra, M.J. and Barros, A.I. 2020. Enhanced phytochemical composition and biological activities of grape (Vitis vinifera L.) stems growing in low altitude regions. Sci Hort. 265: 109248. 10.1016/j.scienta.2020.109248
Guo, C., Yang, J., Wei, J., Li, Y., Xu, J. and Jiang, Y. 2003. Antioxidant activities of peel, pulp and seed fractions of common fruits as determined by FRAP assay. Nutr Res. 23(12): 1719–1726. 10.1016/j.nutres.2003.08.005
Hansen, M.H. and Nielsen, T.H. 2004. An Inventory of Archaic and Classical Poleis. Oxford, UK: OUP.
Hanušovský, O., Gálik, B., Bíro, D., Šimko, M., Juráček, M., Rolinec, M., et al. 2020. The nutritional potential of grape by-products from the area of Slovakia and Austria. Emirates J Food Agric. 1–10. 10.9755/ejfa.2020.v32.i1.2051
Hassanpour, H., Yousef, H., Jafar, H. and Mohammad, A. 2011. Antioxidant capacity and phytochemical properties of cornelian cherry (Cornus mas L.) genotypes in Iran. Sci Hortic. 129(3): 459–463. 10.1016/j.scienta.2011.04.017
Iacopini, P., Baldi, M., Storchi, P. and Sebastiani, L. 2008. Catechin, epicatechin, quercetin, rutin and resveratrol in red grape: content, in vitro antioxidant activity and interactions. J Food Comp Anal. 21(8): 589–598. 10.1016/j.jfca.2008.03.011
Iqbal, Z., Kamran, Z., Sultan, J.I., Ali, A., Ahmad, S., Shahzad, M. I., et al. 2015. Replacement effect of vitamin E with grape polyphenols on antioxidant status, immune, and organs histopathological responses in broilers from 1-to 35-d age. J Appl Poultry Res. 24(2): 127–134. 10.3382/japr/pfv009
Ivanova, V., Stefova, M. and Chinnici, F. 2010. Determination of the polyphenol contents in Macedonian grapes and wines by standardized spectrophotometric methods. J Serbian Chem Soc. 75(1): 45–59. 10.2298/JSC1001045I
Jiménez-Moreno, N., Volpe, F., Moler, J.A., Esparza, I. and Ancín-Azpilicueta, C. 2019. Impact of extraction conditions on the phenolic composition and antioxidant capacity of grape stem extracts. Antioxidants (Basel). 8(12): 597. 10.3390/antiox8120597
Jordão, A.M., Ricardo-da-Silva, J.M. and Laureano, O. 2001. Evolution of proanthocyanidins in bunch stems during berry development (Vitis vinifera L.). J Grapevine Res (Vitis Geilweilerhof). 40(1): 17–22.
Karthikeyan, K., Bai, B.S. and Devaraj, S.N. 2007. Grape seed proanthocyanidins ameliorates isoproterenol-induced myocardial injury in rats by stabilizing mitochondrial and lysosomal enzymes: an in vivo study. Life Sci. 81(23–24): 1615–1621. 10.1016/j.lfs.2007.09.033
Karvela, E., Makris, D.P., Kalogeropoulos, N. and Karathanos, V.T. 2009. Deployment of response surface methodology to optimise recovery of grape (Vitis vinifera) stem polyphenols. Talanta. 79(5): 1311–1321. 10.1016/j.talanta.2009.05.042
Kennedy, J.A., Matthews, M.A. and Waterhouse, A.L. 2000. Changes in grape seed polyphenols during fruit ripening. Phytochemistry. 55(1): 77–85. 10.1016/S0031-9422(00)00196-5
Khoshamad, R., Hassanpour, H. and Rahimi, A. 2020. Evaluation of phenolic compounds, antioxidant activities and antioxidant enzymes of wild grape peel and pulp. J Med Plants Byproduct. 9(1): 33–42.
Leal, C., Santos, R.A., Pinto, R., Queiroz, M., Rodrigues, M., Jose Saavedra, M., et al. 2020. Recovery of bioactive compounds from white grape (Vitis vinifera L.) stems as potential antimicrobial agents for human health. Saudi J Biol Sci. 27(4): 1009–1015. 10.1016/j.sjbs.2020.02.013
Liu, L.L., He, J.H., Xie, H.B., Yang, Y.S., Li, J.C. and Zou, Y. 2014. Resveratrol induces antioxidant and heat shock protein mRNA expression in response to heat stress in black-boned chickens. Poult Sci. 93(1): 54–62. 10.3382/ps.2013-03423
Liu, X., Yan, X., Bi, J., Liu, J., Zhou, M., Wu, X., et al. 2018. Determination of phenolic compounds and antioxidant activities from peel, flesh, seed of guava (Psidium guajava L.). Electrophoresis. 39(13): 1654–1662. 10.1002/elps.201700479
Makris, D.P., Boskou, G. and Andrikopoulos, N.K. 2007. Polyphenolic content and in vitro antioxidant characteristics of wine industry and other agri-food solid waste extracts. J Food Comp Anal. 20(2): 125–132. 10.1016/j.jfca.2006.04.010
Manterola, H., Cerda, D., Porte, E., Machado, C., Sirhan, L. and Mohr, J. 1997. Study of the productive behavior and ruminal parameter variations in steers fed different levels of grape marc. Avances en Prod Anim (Chile).
Marshall, Donna A., Stringer, S.J. and Spiers, J.D. 2012. Stilbene, ellagic acid, flavonol, and phenolic content of muscadine grape (Vitis rotundifolia Michx.) cultivars. Pharm Crops. 3(1): 69–77. 10.2174/2210290601203010069
Martins, S., Mussatto, S.I., Martínez-Avila, G., Montañez-Saenz, J., Aguilar, C.N. and Teixeira, J.A. 2011. Bioactive phenolic compounds: production and extraction by solid-state fermentation. A review. Biotechnol Adv. 29(3): 365–373. 10.1016/j.biotechadv.2011.01.008
Milder, I.E., Arts, I.C., van de Putte, B., Venema, D.P. and Hollman, P.C. 2005. Lignan contents of Dutch plant foods: a database including lariciresinol, pinoresinol, secoisolariciresinol and matairesinol. Br J Nutr. 93(3): 393–402. 10.1079/bjn20051371
Moate, P.J., Williams, S.R., Torok, V.A., Hannah, M.C., Ribaux, B.E., Tavendale, M. H., et al. 2014. Grape marc reduces methane emissions when fed to dairy cows. J Dairy Sci. 97(8): 5073–5087. 10.3168/jds.2013-7588
Montealegre, R.R., Peces, R.R., Vozmediano, J.C., Gascueña, J.M. and Romero, E.G. 2006. Phenolic compounds in skins and seeds of ten grape Vitis vinifera varieties grown in a warm climate. J Food Comp Anal. 19(6–7): 687–693. 10.1016/j.jfca.2005.05.003
Moreno, D.A., Ilic, N., Poulev, A., Brasaemle, D.L., Fried, S.K. and Raskin, I. 2003. Inhibitory effects of grape seed extract on lipases. Nutrition. 19(10): 876–879. 10.1016/s0899-9007(03)00167-9
Nakamura, Y., Tsuji, S. and Tonogai, Y. 2003. Analysis of proanthocyanidins in grape seed extracts, health foods and grape seed oils. J Health Sci. 49(1): 45–54. 10.1248/jhs.49.45
Nassiri-Asl, M. and Hosseinzadeh, H. 2009. Review of the pharmacological effects of Vitis vinifera (grape) and its bioactive compounds. Phytother Res. 23(9): 1197–1204. 10.1002/ptr.2761
Nassiri-Asl, M. and Hosseinzadeh, H. 2016. Review of the pharmacological effects of Vitis vinifera (grape) and its bioactive constituents: an update. Phytother Res. 30(9): 1392–1403. 10.1002/ptr.5644
Nawaz, H., Shi, J., Mittal, G. and Kakuda, Y. 2006. Extraction of polyphenols from grape seeds and concentration by ultrafiltration. Separation Purification Technol. 48: 176–181. 10.1016/j.seppur.2005.07.006
Negro, C., Tommasi, L. and Miceli, A. 2003. Phenolic compounds and antioxidant activity from red grape marc extracts. Bioresour Technol. 87(1): 41–44. 10.1016/S0960-8524(02)00202-X
Ni, Z.-J., Ma, W.-P., Wang, H., Song, C.-B., Thakur, K., Zhang, H., et al. 2017. Stability of health-promoting bioactives and enzymes in skin and pulp of grape during storage. Curr Topics Nutraceut Res : 103–110.
Nicodemus, K.K., Kolachana, B.S., Vakkalanka, R., Straub, R.E., Giegling, I., Egan, M. F., et al. 2007. Evidence for statistical epistasis between catechol-O-methyltransferase (COMT) and polymorphisms in RGS4, G72 (DAOA), GRM3, and DISC1: influence on risk of schizophrenia. Human Genet. 120(6): 889–906. 10.1007/s00439-006-0257-3
Nile, S.H., Kim, S.H., Ko, E.Y. and Park, S.W. 2013. Polyphenolic contents and antioxidant properties of different grape (V. vinifera, V. labrusca, and V. hybrid) cultivars. Biomed Res Int. 2013: 718065. 10.1155/2013/718065
Nollet, L.M. and Gutierrez-Uribe, J.A. 2018. Phenolic Compounds in Food: Characterization and Analysis. Boca Raton, FL: CRC Press. 10.1201/9781315120157
Novak, I., Janeiro, P., Seruga, M. and Oliveira-Brett, A.M. 2008. Ultrasound extracted flavonoids from four varieties of Portuguese red grape skins determined by reverse-phase high-performance liquid chromatography with electrochemical detection. Anal Chim Acta. 630(2): 107–115. 10.1016/j.aca.2008.10.002
Olas, B., Wachowicz, B., Tomczak, A., Erler, J., Stochmal, A. and Oleszek, W. 2008. Comparative anti-platelet and antioxidant properties of polyphenol-rich extracts from: berries of Aronia melanocarpa, seeds of grape and bark of Yucca schidigera in vitro. Platelets. 19(1): 70–77. 10.1080/09537100701708506
Özcan, M.M., Juhaimi, F.A., Gülcü, M., Uslu, N., Geçgel, Ü., Ghafoor, K., et al. 2017. Effect of harvest time on physico-chemical properties and bioactive compounds of pulp and seeds of grape varieties. J Food Sci Technol. 54(8): 2230–2240. 10.1007/s13197-017-2658-9
Palomino, O., Gomez-Serranillos, M., Slowing, K., Carretero, E. and Villar, A. 2000. Study of polyphenols in grape berries by reversed-phase high-performance liquid chromatography. J Chromat A, 870(1–2): 449–451. 10.1016/S0021-9673(99)01225-X
Pantelic, M.M., Dabic Zagorac, D.C., Davidovic, S.M., Todic, S.R., Beslic, Z.S., Gasic, U.M., et al. 2016. Identification and quantification of phenolic compounds in berry skin, pulp, and seeds in 13 grapevine varieties grown in Serbia. Food Chem. 211: 243–252. 10.1016/j.foodchem.2016.05.051
Peña-Neira, A., Duenas, M., Duarte, A., Hernandez, T., Estrella, I. and Loyola, E. 2004. Effects of ripening stages and of plant vegetative vigor on the phenolic composition of grapes (Vitis vinifera L.) cv. Cabernet Sauvignon in the Maipo Valley (Chile). J Grapevine Res (Vitis). 43(2): 51–57.
Pietta, P.G., Simonetti, P., Gardana, C., Brusamolino, A., Morazzoni, P. and Bombardelli, E. 1998. Catechin metabolites after intake of green tea infusions. Biofactors. 8(1–2): 111–118. 10.1002/biof.5520080119
Prusova, B., Licek, J., Kumsta, M., Baron, M. and Sochor, J. 2020. Polyphenolic composition of grape stems. Notulae Botanicae Horti Agrobotan Cluj-Napoca. 48(3): 1543–1559. 10.15835/nbha48311936
Püssa, T., Floren, J., Kuldkepp, P. and Raal, A. 2006. Survey of grapevine Vitis vinifera stem polyphenols by liquid chromatography—diode array detection—tandem mass spectrometry. J Agric Food Chem. 54(20): 7488–7494. 10.1021/jf061155e
Radovanović, V., Andjelković, M., Arsić, B., Radovanović, A. and Gojković-Bukarica, L. 2019. Cost-effective ultrasonic extraction of bioactive polyphenols from vine and wine waste in Serbia. South African J Enology Viticult. 40(2): 172–180. 10.21548/40-2-3215
Ristic, R. and Iland, P.G. 2005. Relationships between seed and berry development of Vitis vinifera L. cv Shiraz: developmental changes in seed morphology and phenolic composition. Aust J Grape Wine Res. 11(1): 43–58. 10.1111/j.1755-0238.2005.tb00278.x
Rockenbach, I.I., Gonzaga, L.V., Rizelio, V.M., Gonçalves, A.E.d.S.S., Genovese, M.I. and Fett, R. 2011. Phenolic compounds and antioxidant activity of seed and skin extracts of red grape (Vitis vinifera and Vitis labrusca) pomace from Brazilian winemaking. Food Res Int. 44(4): 897–901. 10.1016/j.foodres.2011.01.049
Rusjan, D. and Mikulic-Petkovsek, M. 2017. Double maturation raisonnée: the impact of on-vine berry dehydration on the berry and wine composition of Merlot (Vitis vinifera L.). J Sci Food Agric. 97(14): 4835–4846. 10.1002/jsfa.8354
Sahpazidou, D., Geromichalos, G.D., Stagos, D., Apostolou, A., Haroutounian, S.A., Tsatsakis, A.M., et al. 2014. Anticarcinogenic activity of polyphenolic extracts from grape stems against breast, colon, renal and thyroid cancer cells. Toxicol Lett. 230(2): 218–224. 10.1016/j.toxlet.2014.01.042
Sano, T., Oda, E., Yamashita, T., Naemura, A., Ijiri, Y., Yamakoshi, J., et al. 2005. Anti-thrombotic effect of proanthocyanidin, a purified ingredient of grape seed. Thromb Res. 115(1–2): 115–121. 10.1016/j.thromres.2004.07.015
Shi, J., Yu, J., Pohorly, J., Young, J.C., Bryan, M. and Wu, Y. 2003. Optimization of the extraction of polyphenols from grape seed meal by aqueous ethanol solution. J Food Agric Environ. 1(2): 42–47.
Shinagawa, F.B., Santana, F.C.d., Torres, L.R.O. and Mancini-Filho, J. 2015. Grape seed oil: a potential functional food? Food Sci Technol. 35(3): 399–406. 10.1590/1678-457x.6826
Silva, V., Igrejas, G., Falco, V., Santos, T.P., Torres, C., Oliveira, A.M., et al. 2018. Chemical composition, antioxidant and antimicrobial activity of phenolic compounds extracted from wine industry by-products. Food Control. 92: 516–522. 10.1016/j.foodcont.2018.05.031
Singha, I. and Das, S.K. 2015. Free radical scavenging properties of skin and pulp extracts of different grape cultivars in vitro and attenuation of H2O2-induced oxidative stress in liver tissue ex vivo. Indian J Clin Biochem. 30(3): 305–312. 10.1007/s12291-014-0442-4
Souquet, J.-M., Labarbe, B., Le Guernevé, C., Cheynier, V. and Moutounet, M. 2000. Phenolic composition of grape stems. J Agric Food Chem. 48(4): 1076–1080. 10.1021/jf991171u
Szabó, É., Marosvölgyi, T., Szilágyi, G., Kőrösi, L., Schmidt, J., Csepregi, K., et al. 2021. Correlations between total antioxidant capacity, polyphenol and fatty acid content of native grape seed and pomace of four different grape varieties in Hungary. Antioxidants. 10(7): 1101. 10.3390/antiox10071101
Taiz, L., Zeiger, E., Møller, I. M. and Murphy, A. 2015. Plant Physiology and Development. Oxford, UK: OUP (Sinauer Associates).
Teixeira, A., Baenas, N., Dominguez-Perles, R., Barros, A., Rosa, E., Moreno, D.A., et al. 2014. Natural bioactive compounds from winery by-products as health promoters: a review. Int J Mol Sci. 15(9): 15638–15678. 10.3390/ijms150915638
Teixeira, N., Mateus, N., de Freitas, V. and Oliveira, J. 2018. Wine industry by-product: full polyphenolic characterization of grape stalks. Food Chem. 268: 110–117. 10.1016/j.foodchem.2018.06.070
Tomaz, I., Huzanić, N., Preiner, D., Stupić, D., Andabaka, Ž., Maletić, E., et al. 2019. Extraction Methods of polyphenol from grapes: extractions of grape polyphenols. In R.R. Watson (Ed.), Polyphenols in Plants, 2nd ed. Chap. 10 (pp. 151–167): Cambridge, MA: Academic Press. 10.1016/B978-0-12-813768-0.00010-4
Topalovic, A. and Mikulic-Petkovsek, M. 2010. Changes in sugars, organic acids and phenolics of grape berries of cultivar cardinal during ripening. J. Food Agric Environ. 8(3): 223–227.
Tortuero, F., Rioperez, J., Cosin, C., Barrera, J. and Rodriguez, M. 1994. Effects of dietary fiber sources on volatile fatty acid production, intestinal microflora and mineral balance in rabbits. Anim Feed Sci Technol. 48(1–2): 1–14. 10.1016/0377-8401(94)90107-4
Tsimogiannis, D. and Oreopoulou, V. 2019. Classification of phenolic compounds in plants. In Polyphenols in Plants (pp. 263–284): Cambridge, MA: Elsevier. 10.1016/B978-0-12-813768-0.00026-8
Vaquero, M.R., Alberto, M.R. and De Nadra, M.M. 2007. Antibacterial effect of phenolic compounds from different wines. Food Control. 18(2): 93–101. 10.1016/j.foodcont.2005.08.010
Vujasinović, V.B., Bjelica, M.M., Čorbo, S.C., Dimić, S.B. and Rabrenović, B.B. 2021. Characterization of the chemical and nutritive quality of coldpressed grape seed oils produced in the Republic of Serbia from different red and white grape varieties. Grasas y Aceites. 72(2): 1–13. 10.3989/gya.0222201
Wang, M.L., Suo, X., Gu, J.H., Zhang, W.W., Fang, Q. and Wang, X. 2008. Influence of grape seed proanthocyanidin extract in broiler chickens: effect on chicken coccidiosis and antioxidant status. Poult Sci. 87(11): 2273–2280. 10.3382/ps.2008-00077
War, A.R., Paulraj, M.G., Ahmad, T., Buhroo, A.A., Hussain, B., Ignacimuthu, S., et al. 2012. Mechanisms of plant defense against insect herbivores. Plant Signal Behav. 7(10): 1306–1320. 10.4161/psb.21663
Wen, X., Zhu, M., Hu, R., Zhao, J., Chen, Z., Li, J., et al. 2016. Characterisation of seed oils from different grape cultivars grown in China. J Food Sci Technol. 53(7): 3129–3136. 10.1007/s13197-016-2286-9
Wenzel, J., Samaniego, C.S., Wang, L., Nelson, L., Ketchum, K., Ammerman, M., et al. 2015. Superheated liquid and supercritical denatured ethanol extraction of antioxidants from crimson red grape stems. Food Sci Nutr. 3(6): 569–576. 10.1002/fsn3.246
Wongnarat, C. and Srihanam, P. 2017. Phytochemical and antioxidant activity in seeds and pulp of grape cultivated in Thailand. Oriental J Chem. 33(1): 113–121. 10.13005/ojc/330112
Yan, L. and Kim, I. 2011. Effect of dietary grape pomace fermented by Saccharomyces boulardii on the growth performance, nutrient digestibility and meat quality in finishing pigs. Asian-Australasian J Anim Sci. 24(12): 1763–1770. 10.5713/ajas.2011.11189
Yilmaz, Y. and Toledo, R.T. 2004. Major flavonoids in grape seeds and skins: antioxidant capacity of catechin, epicatechin, and gallic acid. J Agric Food Chem. 52(2): 255–260. 10.1021/jf030117h