
Download

Inhibition of ABTS % = ( A control − A sample ) A control × 1 00 Inhibition of DPPH % = ( A control − A sample ) A control × 1 00
PAPER
Assessment of the bioaccessibility of phenolic compounds and antioxidant activity in raw and pickled white cabbage and gherkins
Müzeyyen Berkel Kaşıkçı*, Neriman Bağdatlıoğlu
Food Engineering Department, Faculty of Engineering, Manisa Celal Bayar University, Manisa, Turkey
Abstract
White cabbage and gherkin are vegetables that are widely consumed as pickles as well as raw vegetables. In this research, we explored the effect of pickling on the bioaccessibility of phenolics and flavonoids and changes in antioxidant activity after in vitro digestion. In general, the pickling process enhances the bioaccessibility of phenolics and flavonoids in white cabbage and gherkin. The bioaccessibility of total phenolics (TP) in cabbages, pickled cabbages, gherkins, and pickled gherkins is determined as 125.2%, 185.1%, 369.2%, and 462%, respectively. In contrast, after in vitro digestion of raw and pickled vegetables, total antioxidant activity is reduced. So it can be concluded that both raw and pickled gherkins are good sources of bioaccessible phenolics and flavonoids. The consumption of these vegetables and their pickles is suggested to promote the reduction of diseases plagued by free radicals.
Key words: antioxidant, bioaccessibility, cabbage, gherkin, phenolics, pickle
*Corresponding Author: Müzeyyen Berkel Kaşıkçı, Food Engineering Department, Faculty of Engineering, Manisa Celal Bayar University, Manisa, Turkey. Email: [email protected]
Received: 22 August 2022; Accepted: 19 September 2022; Published: 6 October 2022
© 2022 Codon Publications
This is an Open Access article distributed under the terms of the Creative Commons Attribution-NonCommercial-ShareAlike 4.0 International (CC BY-NC-SA 4.0). License (http://creativecommons.org/licenses/by-nc-sa/4.0/)
Introduction
White cabbage and gherkin are consumed substantially throughout the world. White cabbage and gherkin are the most popular pickles and are consumed in raw form. In the United States, 245.85 million Americans consumed pickles in 2020. It is expected to increase to 251.03 million in 2023 (Statistica Research Department, 2022). The size of the global market for packed pickles, which was 7.9 billion in 2018, is expected to increase at a compound annual growth rate (CAGR) of 3.5% until 2025 (Grand View Research, 2019). Global consumption of cabbages and other brassicas, both raw and pickled, was 70.7 million tonnes in 2015 (Indexbox, 2016a). In 2015, 78.5 million tons of gherkins and cucumbers, both raw and pickled, were consumed globally (Indexbox, 2016b). In 2015, import and export volumes of pickled gherkins and cucumbers were 557.000 and 554.300 tonnes, respectively (Indexbox, 2016c).
Oxidative stress causes the formation of free radicals and other reactive oxygen species, which are involved in many diseases, particularly chronic degenerative diseases such as cancer, diabetes, cardiovascular disease, and obesity. As a result, reactive compounds must be quenched by antioxidants. Phenolic compounds are secondary metabolites of plants and have antioxidant properties. Phenolic compounds have several groups such as flavonoids, lignans, and phenolic acids. Flavonoids is comprised of quercetin, kaempferol, lutein, and naringenin. Some of phenolic acids are gallic acid, chlorogenic acid, and syringic acid (Tapia-Hernández et al., 2018; Del-Toro-Sánchez et al., 2021; Maribel Perez-Perez et al., 2018). Gherkins and white cabbages have several antioxidant compounds, which can be categorized into phenolic compounds and non-phenolic compounds. As shown in Figure 1, the main antioxidant compounds in gherkin are flavonoids, tannins, triterpenes, alkoloids, and saponins (Mohamed et al., 2022; Omokhua-Uyi et al., 2020; Dimitry et al., 2022; Murthy et al., 2022). The main antioxidant compounds in white cabbage are phenolic acids, flavonoids, lignans, and glucosinolates (Kuljarachanan et al., 2021; Demir et al., 2023; Tao et al., 2019; Zhou et al., 2022; Cvetković et al., 2019).
Figure 1. Antioxidant compounds in gherkin and white cabbage.
These vegetables are healthy due to their phenolic content and antioxidant properties (Sayın et al., 2015; Song et al., 2010; Bahorun et al., 2004). Phenolic compounds have antiviral, anti-allergic, antiplatelet, anti-inflammatory, antitumor, and antioxidant properties (Yao et al., 2004). To exploit these benefits for humans, phenolic compounds should be bioaccessible and bioavailable. Bioaccessibility is the fraction of a compound that can reach the intestine by passing through the intestinal barrier.
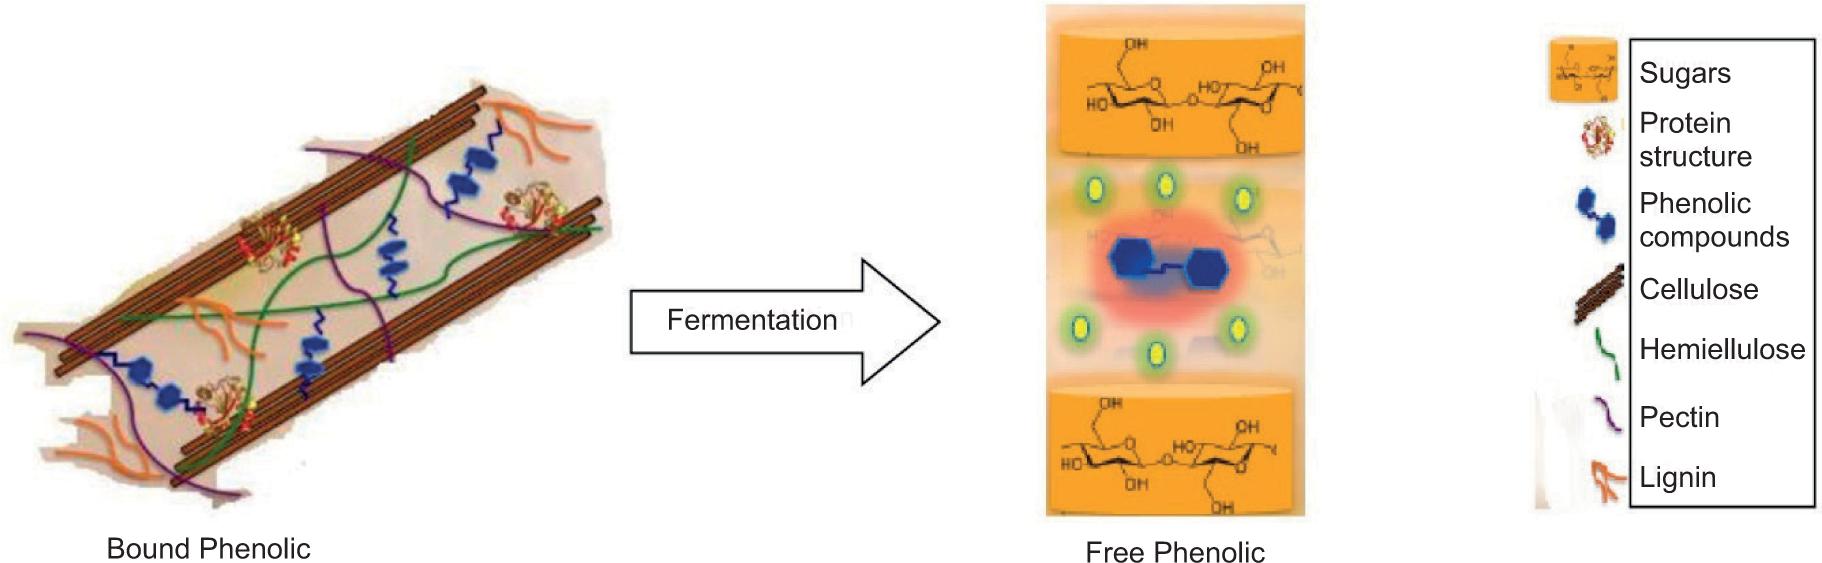
Although the bioaccessibility of phenolics in different cabbage species has been studied previously (Kaulmann et al., 2016; Tomas et al., 2021), no studies about the bioaccessibility of phenolics and changes in antioxidant activity during simulated gastrointestinal digestion for white cabbages, pickled white cabbages, gherkins, and pickled gherkins have been reported in the literature. Our hypothesis is that the fermentation process loosens other molecules in the food matrix and allows the bound phenolics to be released from the cell wall, as depicted in Figure 2. On the other hand, fermentation can degrade vulnerable phenolics, and the bioaccessible fraction can be decreased.
Figure 2. Conversion of bound phenolics to free phenolics by fermentation (Maribel Perez-Perez et al., 2018).
Therefore, the objective of this research was to assess the effect of the pickling process on the bioaccessibility of phenolics and antioxidant activity in cabbage and gherkin. For achieving this objective, the total phenolic content (TPC), total flavonoid content (TFC), and antioxidant activity (2,2'-azino-bis(3-ethylbenzothiazoline-6-sulfonic acid) diammonium salt [ABTS], 2,2-diphenyl-1-picrylhydrazyl [DPPH], and ferric reducing antioxidant power [FRAP]) were determined before and after in vitro digestion.
Materials and Methods
Chemicals
Phenolphtalein, sodium carbonate, catechin, 2,4,6-tris(2-pyridyl)-s-triazine (TPTZ), iron(II) sulphate, 2,2-diphenyl-1-picrylhydrazyl (DPPH), 6-hydroxy-2,5,7,8-tetramethylchromane-2-carboxylic acid (Trolox), 2,2'-azino-bis(3-ethylbenzothiazoline-6-sulfonic acid) diammonium salt (ABTS), potassium persulfate, potassium dihydrogen phosphate, dipotassium hydrogen phosphate, haemoglobin, Tris (hydroxymethyl) aminomethane (Trizma base), p-toluene sulfonyl-L-arginine methyl ester (TAME), pepsin, pancreatin, bile salt, methanol (≥%99.9), hyperoside and 4-hydroxybenzoic acid (4-HBA) standards were purchased from Sigma Aldrich (USA). Sodium hydroxide, potassium chromate, silver nitrate, sodium chloride, De Man Rogosa and Sharpe (MRS) agar, formic acid, Folin-Cioceltau, gallic acid, sodium nitrite, aluminium chloride, sodium hydroxide, sodium acetate trihydrate, glacial acetic acid, hydrochloric acid, iron(III) chloride, and calcium chloride dihydrate were obtained from Merck. Potassium chloride and ammonium carbonate were acquired from Riedel-de Haen (Germany). Sodium bicarbonate, magnesium chloride dihydrate, and acetonitrile (≥99.9%) were purchased from Carlo Elba (France). Pefabloc was obtained from Acros (USA). SM-199 Lactobacillus plantarum culture was purchased from Chris Hansen (Germany).
Cabbages and gherkins
Cabbage and gherkin samples were purchased from a local market in Manisa, Turkey. Small and firm cabbages and gherkins ranging in length from 3 to 6 cm were selected.
Pickling procedure
Cabbages and gherkins were placed into 660 mL jars with brine composed of 6% salt and 0.05% vinegar. Cabbage and gherkin brine were adjusted to 105 and 106 cfu/mL lactic acid bacteria (LAB), respectively, by using Chris Hansen SM-199 Lactobacillus plantarum culture, respectively. The weights of the vegetables and composition of the brine in the jar is shown in Table 1. Titratable acidity, pH, salt analyses, and total LAB counts were performed in brines and pickles.
Table 1. Formulation of pickles in a jar.
| Cabbage pickle | Gherkin pickle | |
|---|---|---|
| Weight of the vegetables (g) | 245 ± 2 | 310 ± 2 |
| Volume of brine (mL) | 295 | 250 |
| Volume of the culture solution (mL) | 10 | 10 |
| Total volume of brine (mL) | 305 | 260 |
| Volume of the jar (mL) | 660 | 660 |
Extraction of phenolic compounds
The extraction procedure reported by (Bovy et al., 2002) was used with slight modifications. Samples were ground in a Waring blender, and 4 g of each sample was then homogenized in 10 mL of 75% methanol and incubated for 15 min in an ultrasonic water bath. Afterward, samples were subjected to a 2000 g, 10 min, 4°C centrifugation procedure. The extraction procedure was repeated three times, with the second and third extractions that included the addition 5 mL of 75% methanol. The supernatants were transferred to a plastic container, resulting in a final volume of 20 mL by adding 75% methanol. For further analysis, extracts were stored at −86 °C.
In vitro gastrointestinal digestion
The in vitro gastrointestinal digestion of samples was performed following the method described by (Minekus et al., 2014), which involves oral, gastric, and intestinal phases. The only difference is that no salivary α-amylase was used in our protocol. Pepsin and pancreatin activity analyses were performed according to (Minekus et al., 2014).
Note that 5 g of each sample were grounded in a Waring blender to mimic chewing process and mixed with 3.5 mL simulated saliva fluid (SSF), which was composed of 15.1 mmol/L KCl, 3.7 mmol/L KH2PO4, 13.6 mmol/L NaHCO3, 0.15 mmol/L MgCl2(H2O)6, and 0.06 mmol/L (NH4)2CO3. The mixture was then mixed with 25 µL of 0.3 M CaCl2(H2O)2. Afterward, the pH was adjusted to 7, and distilled water was added to make a total volume of 10 mL. In order to complete oral digestion, the mixture was shaken for 2 min at 100 rpm in a 37°C shaking incubator.
Following oral digestion, gastric digestion procedures were carried out immediately. To the oral bolus, 7.5 mL of simulated gastric fluid (SGF), containing 6.9 mmol/L KCl, 0.9 mmol/L KH2PO4, 25 mmol/L NaHCO3, 47.2 mmol/L NaCl, 0.1 mmol/L MgCl2(H2O)6, and 0.5 mmol/L (NH4)2CO3 was added. Then, pepsin enzyme of 2000 U/mL activity and 5 µL of 0.3 M CaCl2(H2O)2 were added, and the pH was adjusted to 3 with 6 M HCl. Then 20 mL of total volume was obtained by adding distilled water. Samples are kept in a shaking incubator at 100 rpm, 37°C for 2 h to mimic gastric conditions.
Intestinal digestion was performed immediately after gastric digestion. 11 mL simulated intestinal fluid (SIF), which was composed of 6.8 mmol/L KCl, 0.8 mmol/L KH2PO4, 85 mmol/L NaHCO3, and 38.4 mmol/L NaCl, and 0.33 mmol/L MgCl2(H2O)6 was added to the gastric bolus. Then, pancreatin enzyme (100 U/mL tripsin activity), 10 mM bile extract, and 40 µL of 0.3 M CaCl2(H2O)2 were added to gastric bolus and pH was adjusted to 7 with 1 M NaOH. Then, distilled water was added to make a total volume of 40 mL. Finally, samples were incubated for 2 h in a shaking incubator at 100 rpm and 37°C to simulate intestinal conditions.
After all digestion procedures were completed, the enzyme reactions were halted by adding 150 mM Pefabloc enzyme inhibitor to the digested samples. The digested samples were subjected to 4000 rpm, 10 min, 4°C centrifugation procedure. The supernatant that remains on top was transferred to sample tubes and stored at −86°C until further analysis.
Total phenolic content (TPC)
TPCs were assessed using the Folin-Cioceltau technique with some modifications as described by (Miceli et al., 2009). Then, 100 mL of appropriately diluted sample extract was combined with 200 mL of 0.2 N Folin-Cioceltau reagent. Then, 1 mL of 6% NaCo3 solution and 2 mL of pure deionized water were added and vortexed. The mixture was incubated at room temperature for 2 h before the absorbance at a wavelength of 765 nm was measured with a Multiskan GO UV/Vis Microplate Spectrophotometer (Thermo Fisher Scientific, USA). The results are given as milligrams of gallic acid equivalents (GAE) per 100 g of fresh weight (FW).
Total flavonoid content (TFC)
TFCs were determined using the method provided by (Dewanto et al., 2002) with some changes. A total of 250 µL of appropriately diluted sample extract was combined with 1.25 mL of pure deionized water. After adding 75 µL of sodium nitrite and letting it sit for 6 min, 150 µL of aluminium chloride was then added. After 5 min, a total mixture amount of 2.5 mL was obtained by adding 0.5 mL NaOH and pure deionized water. Prior to the measurement of the absorbance at 510 nm with a Multiskan GO UV/Vis Microplate Spectrophotometer (Thermo Fisher Scientific, USA), the mixture was vortexed. The results are presented as milligrams of catechin equivalents (CEs) per 100 g of FW.
Total antioxidant activity (TAA)
Three different methods, ABTS, DPPH, and FRAP, were used to measure the total TAA.
The ABTS method was applied (Miller et al., 1997) with various adjustments. Different extract volumes (1–20 µL) were combined with pure deionized water to create a final volume of 20 µL. Following the addition of 180 µL of ABTS, the absorbance at 734 nm was measured after 30 s. The identical procedure was carried out for the control using 20 µL of pure deionized water. Using 20 µL Trolox standards, the same procedure was also carried out.
This is how the percentage inhibition of ABTS was determined:
where Acontrol = absorbance of the control solution and Asample = absorbance of the sample solution.
A graph showing the inhibition of the ABTS (%)-amount of sample (mg) was created for each sample. The inbition of the ABTS (%)-amount of Trolox (µg) plot was also created. The ABTS antioxidant activity was estimated by dividing the slope of the sample graph by the slope of the Trolox graph. The results were expressed as Mg Trolox equivalents/100 g of sample.
With some adjustments, the DPPH method was assayed in accordance with (Brand-Williams et al., 1995; Singh et al., 2002). A final volume of 200 µL was created by mixing different extract volumes (1, 10, 25, and 50 µL) with 75% methanol. Then, 3.8 mL DPPH solution was added. After 30 min of incubation, the absorbance of the mixtures was measured at a wavelength of 515 nm. The identical procedure was carried out for the control using 200 µL of pure deionized water. The same procedure was also carried out by using 200 µL Trolox standards.
The percent inhibition of DPPH was calculated as follows:
where Acontrol = absorbance of control, Asample = absorbance of sample
A graph of inhibition of DPPH (%) versus amount of sample (mg) was drawn for each sample. The inhibition of DPPH (%) versus the amount of Trolox (µg) was also plotted. The DPPH antioxidant activity was calculated by dividing the slope of the sample graph by the slope of the Trolox graph. The results were expressed as mg Trolox equivalents/100 g of sample.
The ferric reducing antioxidant power (FRAP) method was used according to (Liu et al., 2008; Wang et al., 2012).
Statistical analysis
The statistical software SPSS 16.0 was used to conduct the statistical analysis. The results are expressed as the mean ± standard deviation. The paired sample t-test was used to analyze the differences in the mean values between two paired comparisons. Differences between the means were considered significant at P < 0.05. Correlation coefficients (R2) between different methods were calculated.
Results and Discussion
Physical and chemical properties of raw vegetables and their pickles
The results of humidity (%), pH, acidity (%), and salt (%) analyses are shown in Table 2. The humidity (%) of the cabbage, gherkin, pickled cabbage, and pickled gherkin is determined as 92.44% ± 0.93, 95.12% ± 1.25, 92.8 ± 0.92, and 94.1 ± 0.49, respectively. The pH values for cabbage and gherkin are 6.74 and 6.55, respectively, and the pickling process reduces the pH values to 3.55 and 3.73 for pickled cabbage and pickled gherkin, respectively. The salt content (%) for pickled cabbage and pickled gherkin is balanced at 2.85% and 2.55%, respectively. The total LAB for pickled cabbage and pickled gherkin is 5.60 ×10⁶ cfu/g and 2.67 ×10⁷ cfu/g, respectively.
Table 2. Physical and chemical properties of the raw vegetables.
| Humidity (%) | pH | Acidity (%) | Salt (%) | |
|---|---|---|---|---|
| Cabbage | 92.44 ± 0.93 | 6.74 ± 0.20 | 0.14 ± 0.00 | 0.31 ± 0.03 |
| Gherkin | 95.12 ± 1.25 | 6.55 ± 0.17 | 0.14 ± 0.00 | 0.19 ± 0.04 |
| Pickled cabbage | 92.80 ± 0.92 | 3.55 ± 0.02 | 0.73 ± 0.02 | 2.85 ± 0.09 |
| Pickled gherkin | 94.10 ± 0.49 | 3.73 ± 0.09 | 0.57 ± 0.02 | 2.55 ± 0.03 |
Total phenolic content (TPC)
The TPCs of cabbages before and after in vitro digestion and the bioaccessibility values are shown in Table 3. The TPC of cabbages and pickled cabbages is 104.3 ± 6.5 and 107.3 ± 1.5 mg GAE/100 g, respectively. Fermentation with Lactobacillus plantarum does not change the TPC of the cabbage (P > 0.05).
Table 3. Total phenolic content (TPC) and total flavonoid content (TFC) of cabbages.
| Total Phenolic Content (TPC) (mg GAE/100 g) | Total Flavonoid Content (TFC) (mg CE/100 g) | |||||
|---|---|---|---|---|---|---|
| Before in vitro digestion | After in vitro digestion | BA (%) | Before in vitro digestion | After in vitro digestion | BA (%) | |
| Cabbage | 104.3 ± 6.5A, b | 130.2 ± 2.9B, a | 125.2 ± 9.4B | 1.85 ± 0.31A, b | 2.30 ± 0.42A, a | 124.3 ± 12.4B |
| Pickled cabbage | 107.3 ± 1.5A, b | 198.6 ± 8.5A, a | 185.1 ± 10.0A | 1.89 ± 0.36A, b | 3.07 ± 0.78A, a | 161.2 ± 17.0A |
Values are the mean ± standard deviation. A-B different letters indicate that the difference between the values in the same column is significant at the P < 0.05 level. a-b different letters indicate that the difference between the values in the same row is significant at the P < 0.05 level.
In a previous study (Sayın et al., 2015), the fermentation process was found to increase TPC initially and then decrease the TPC of white cabbage. In another spontaneous fermentation study, fermentation decreased the TPC of white cabbage (Parada et al., 2022). Sauerkraut production was found to increase TPC and some individual phenolics (Ciska et al., 2005a; Tlais et al., 2022). In these studies, except a study (Tlais et al., 2022), bacterial culture was not used in brine processing, but Lactobacillus plantarum was used in our study. Different fermentation conditions, such as temperature, time, microorganisms, acidity and pH, are probably responsible for the variation in the TPC after the brining process (Sayın et al., 2015; Ciska et al., 2005b).
After in vitro digestion, the TPC of cabbage and pickled cabbage is increased to 130.2 ± 2.9 and 198.6 ± 8.5 mg GAE/100 g, respectively. The bioaccessibility of TPC is higher for pickled cabbage (185.1%) than cabbage (125.2%) (P < 0.05). The increase in TPC values after in vitro digestion is probably related to the release of bound phenolic compounds in the matrix of the cabbage. In the literature, no study has investigated the bioaccessibility values for total phenolics (TP) for white cabbage. In a study of red cabbage (Vanhoutte, 2014), alkaline hydrolysis was applied to red cabbage, and it was found that the alkaline extract contained a total phenolic content of more than 3 times that of the methanolic extract of red cabbage. This indicates that the majority of phenolics in red cabbage consist of nonextractable phenolics. Alkali hydolysis can break ether and ester bonds (Vanhoutte, 2014; Acosta-Estrada et al., 2014; Rashmi et al., 2020). Similarly, sodium hydroxide (NaOH) is used in the intestinal digestion part of our study, as in alkaline hydrolysis. The TPC of white cabbage is increased after in vitro digestion in our study, indicating that some of the phenolics in white cabbage are composed of nonextractable phenolics and that the alkali application leads to the release of phenolics via the breaking of ether and ester bonds.
The higher bioaccessibility of TP in pickled cabbages compared to cabbages can be explained by the protective effect of fermentation. Although the protective mechanism for fermentation has not yet been fully explained, it is thought that lactic acid produced by fermentation can alleviate the negative effect of pH on phenolic compounds by providing hydrogen ions and creating a buffer environment (Zhao et al., 2016).
Fermentation decreases the TPC for gherkins from 40.3 ± 0.2 to 29.4 ± 1.4 mg GAE/100 g (P < 0.05); this value is similar with (Kiczorowski et al., 2022), but is lower than that found in another literature (Ciniviz et al., 2020). After the in vitro digestion process, TPC values for gherkins and pickled gherkins are increased to 149.1 ± 7.3 and 136.2 ± 11.2 mg GAE/100 g, respectively. The bioaccessibility values for gherkin and pickled gherkin are determined to be 369.2% and 462.0%, respectively (P < 0.05). Higher bioaccessibility values in pickled gherkins are probably related to the protective effect of fermentation (Zhao et al., 2016; Leonard et al., 2021; Ed Nignpense et al., 2022).
After in vitro digestion, it was shown that the TPC value in both the cabbage and cucumber samples is increased. There is no study in the literature that investigates the TPC after in vitro digestion of white cabbage and gherkin samples, but there are many studies that show an increase in the TPC after the in vitro digestion process in various foods. The release of phenolic compounds from the food matrix due to a change in pH values, digestive fluids and enzymes during digestion is thought to be the underlying cause for this increase in TP value after digestion. The activities of enzymes can lead to hydrolysis of phenolics bound to other food components. Enzymes can disintegrate high molecular weight compounds such as proteins and carbohydrates, thus enabling the release of phenolics attached to these macromolecules (Bouayed et al., 2012; Thomas-Valdés et al., 2018; Celep et al., 2017; Ti et al., 2015; Tomas et al., 2018; da Silva Fernandes et al., 2017; Ed Nignpense et al., 2022). The Folin-Cioceltau method is a simple and useful method for determining TP. Nonphenolic compounds such as ascorbic acid, sugars, aromatic amines, organic acids, and proteins are also likely to react with Folin reagent, leading to an overestimation of the amount of phenolic compounds. Despite the fact that many different compounds reduce the Folin reagent, these interfering compounds remain in the food matrix prior to digestion. As a result, although the Folin method is not selective enough, it can be used to demonstrate an increase in the concentration of Folin reagent reducing compounds when compared to the control sample (Fernandes et al., 2017; Prior, 2005).
Total flavonoid content (TFC)
The TFC of cabbages and gherkins before and after in vitro digestion is shown in Tables 3 and 4. The TF values for cabbages (1.85 ± 0.31 mg CE/100 g) and pickled cabbages (1.89 ± 0.36 mg CE/100 g) are similar (P > 0.05). In vitro digestion increases the TFC of raw and pickled cabbage. The TF bioaccessibility of raw and pickled cabbages is 124.3% and 161.2%, respectively (P > 0.05). Similar to the bioaccessibility of TPC, the bioaccessibility of TFC is also higher in pickled cabbages, probably due to the protective effect of fermentation (Zhao et al., 2016).
Table 4. Total phenolic content (TPC) and total flavonoid content (TFC) of gherkins.
| Total Phenolic Content (TPC) (mg GAE/100 g) | Total Flavonoid Content (TFC) (mg CE/100 g) | |||||
|---|---|---|---|---|---|---|
| Before in vitro digestion | After in vitro digestion | BA (%) | Before in vitro digestion | After in vitro digestion | BA (%) | |
| Gherkin | 40.4 ± 0.2A, b | 149.1 ± 7.3A, a | 369.2 ± 17.2B | 0.34 ±0.12A,b | 1.19±0.45A,a | 347.7±5.6A |
| Pickled gherkin | 29.4 ± 1.4B, b | 136.2± 11.2A, a | 462.0 ± 17.1A | 0.23 ± 0.04A,b | 0.78±0.12A,a | 348.2±3.2A |
Values are the mean ± standard deviation. A-B different letters indicate that the difference between the values in the same column is significant at the P < 0.05 level. a-b different letters indicate that the difference between the values in the same row is significant at the P < 0.05 level.
The TFC of gherkin and pickled gherkin is 0.34 and 0.23 mg CE/100 g, respectively (P > 0.05). After in vitro digestion, the TFC for gherkin and pickled gherkin is increased to 1.19 and 0.78 mg CE/100 g, respectively. The TF bioaccessibility for raw (347.7%) and pickled gherkins (348.2%) is similar.
After in vitro digestion, the TF values for both cabbages and gherkins are increased, which show a similar trend to that observed for the TP values.
ABTS, DPPH, and FRAP antioxidant activity
The TAA of gherkins and cabbages was determined by measuring their free radical scavenging activities using the ABTS, DPPH, and FRAP methods. The values and changes after in vitro digestion are shown in Tables 5 and 6.
Table 5. ABTS, DPPH, and FRAP antioxidant activity values for cabbage.
| ABTS (mg TE/100 g) | DPPH (mg TE/100 g) | FRAP (mmol Fe/100 g) | |||||||
|---|---|---|---|---|---|---|---|---|---|
| Before in vitro digestion | After in vitro digestion | DF (%) | Before in vitro digestion | After in vitro digestion | DF (%) | Before in vitro digestion | After in vitro digestion | DF (%) | |
| Cabbage | 25.1 ± 0.9A,a | 13.8 ± 2.4A,b | (−) 45.1 | 9.7 ± 0.7A,a | 9.8 ± 1.1A,a | (+) 1.4 | 0.30 ± 0.02A,a | 0.29 ± 0.04A,a | (−) 1.42 |
| Pickled cabbage | 24.3 ± 0.9A,a | 13.8 ± 2.8A,b | (−) 43.6 | 9.3 ± 0.5A,a | 9.1 ± 1,2A,a | (−) 2.8 | 0.32 ± 0.01A,a | 0.34 ± 0.02A,a | (−) 6.32 |
Values are the mean ± standard deviation. A-B different letters indicate that the difference between the values in the same column is significant at the P < 0.05 level. a-b different letters indicate that the difference between the values in the same row is significant at the P < 0.05 level. DF: Difference.
Table 6. ABTS, DPPH, and FRAP antioxidant activity values for gherkins.
| ABTS (mg TE/100 g) | DPPH (mg TE/100 g) | FRAP (mmol Fe/100 g) | |||||||
|---|---|---|---|---|---|---|---|---|---|
| Before in vitro digestion | After in vitro digestion | DF (%) | Before in vitro digestion | After in vitro digestion | DF (%) | Before in vitro digestion | After in vitro digestion | DF (%) | |
| Gherkin | 16.1 ± 0.8A,a | 12.2 ± 0.7A,b | (−) 24.2A | 8.06 ± 0.10A,a | 6.06 ± 0.34A,b | (−) 24.8A | 0.35 ± 0.02A,a | 0.40 ± 0.0B,a | (+) 14.7B |
| Pickled gherkin | 15.2 ± 1.0A,a | 10.5 ± 1.6A,b | (−) 30.9A | 7.03 ± 0.2B,a | 5.23 ± 0,22B,b | (−) 25.6A | 0.40 ± 0.04A,b | 0.55 ± 0.0A,a | (+) 36.8A |
Values are the mean ± standard deviation. A-B different letters indicate that the difference between the values in the same column is significant at the P < 0.05 level. a-b different letters indicate that the difference between the values in the same row is significant at the P < 0.05 level. DF: Difference.
Raw cabbages (25.11 mg TE/100 g) and pickled cabbages (24.33 mg TE/100 g) show comparable ABTS antioxidant activity values (P > 0.05). (Sayın et al., 2015) found that fermentation first increases and then decreases ABTS antioxidant activity. ABTS antioxidant activity was found to remain unchanged by brining in another study, similar to our study (Girgin et al., 2015). In vitro digestion decreases the ABTS antioxidant activity values for raw and pickled cabbage by 45.1% and 43.6%, respectively.
The DPPH antioxidant activity of raw and pickled cabbages is 9.68 and 9.33 mg TE/100 g (P > 0.05), respectively, and no change is observed after the brining process, similar to results reported in the literature (Girgin et al., 2015). Differently, in a previous research, the DPPH antioxidant activity of white cabbage increased on day 1 and then lowered through fermentation, probably due to the passage of antioxidant compounds to the brine (Parada et al., 2022). After in vitro digestion, DPPH antioxidant activity is found to remain unaffected by in vitro digestion of raw and pickled cabbage.
The FRAP antioxidant activity values obtained for the cabbages were similar. The FRAP antioxidant activities of raw cabbage, pickled cabbage, digested raw cabbage, and digested pickled cabbage are determined to be 0.30, 0.32, 0.29, and 0.34 mmol Fe/100 g, respectively.
The ABTS antioxidant activity values for gherkin and pickled gherkin are determined as 16.11 and 15.19 mg TE/100, respectively (P > 0.05). After in vitro digestion, the ABTS antioxidant activity of gherkin and pickled gherkin is reduced by 24.2% and 30.9%, respectively (P > 0.05).
While the DPPH antioxidant activity value in gherkin is 8.06 mg/TE, this value is decreased to 7.03 mg TE/100 g for pickled gherkin. It is observed that DPPH antioxidant activity values are decreased after in vitro digestion of gherkin and pickled gherkin compared to before digestion. After the digestion of gherkins and pickled gherkins, the DPPH antioxidant values are decreased by 24.8% and 25.6%, respectively.
The FRAP antioxidant activity values for gherkin and pickled gherkin are determined as 0.35 and 0.40 mmol Fe/100 g, respectively (P > 0.05). The FRAP antioxidant activity value before digestion in gherkin, 0.35 mmol Fe/100 g, becomes 0.40 after in vitro digestion (P > 0.05). The FRAP antioxidant value of pickled gherkins (0.40 mmol Fe/100 g) is increased to 0.55 mmol Fe/100 g (P < 0.05).
Correlations between TP, TF, ABTS, DPPH, and FRAP
The correlation coefficients between TP, TF, ABTS, DPPH, and FRAP values were determined by only using the values obtained for the cabbage samples and are shown in Table 7. The strongest correlation is found to occur between the TP and TF in cabbage samples. TP and TF give the highest positive correlation coefficients for FRAP antioxidant activity among the antioxidant activity tests. It is also observed that there is no strong positive correlation between antioxidant activity values in cabbage samples. In the literature, while a very strong correlation has been found between ascorbic acid and ABTS, the TP-ABTS correlation is insignificant (Güleç et al., 2013). In another study conducted using Brassica vegetables, including cabbage, the TP-FRAP and TF-FRAP correlation coefficients were determined to be 0.357 and −0.0737, respectively (Jaiswal et al., 2011).
Table 7. Correlation coefficients between TP, TF, ABTS, DPPH, and FRAP in cabbage.
| TF | ABTS | DPPH | FRAP | |
|---|---|---|---|---|
| TP | 0.768 | −0.788 | −0.279 | 0.577 |
| TF | – | −0.538 | 0.048 | 0.663 |
| ABTS | – | – | 0.289 | −0.193 |
| DPPH | – | – | – | −0.211 |
The correlation coefficients between TP, TF, ABTS, DPPH, and FRAP values were calculated using values obtained for the gherkin sample and are shown in Table 8. The strongest positive correlations were found to occur between ABTS-DPPH and TP-TF. According to the data obtained, the phenolic compounds in gherkins have little effect on antioxidant activity. However, FRAP antioxidant activity is found to have the highest positive correlation with TP and TF among antioxidant activity analyses.
Table 8. Correlation coefficients between TP, TF, ABTS, DPPH, and FRAP in gherkins.
| TF | ABTS | DPPH | FRAP | |
|---|---|---|---|---|
| TP | 0.841 | −0.854 | –0.835 | 0.524 |
| TF | – | −0.710 | −0.643 | 0.276 |
| ABTS | – | – | 0.939 | −0.698 |
| DPPH | – | – | – | −0.790 |
Conclusion
White cabbages, gherkins, and their pickles are healthy foods due to their phenolic and flavonoid contents and antioxidant activity. Fermentation does not affect TPC, TFC, or antioxidant activity in white cabbage. For gherkin, TFC and antioxidant activity are also not affected by fermentation, but the TPC is decreased. The bioaccessibility of the TPC and TFC for raw vegetables is lower than that for pickled vegetables; fermentation probably leads to looser bonds between phenolic compounds and other molecules in the food matrix, and these compounds are easily released after in vitro digestion. Fermentation also has a protective effect on phenolics. Both raw and pickled white cabbages and gherkins contain highly bioaccessible phenolics.
Acknowledgments
This research was funded by The Scientific and Technological Research Council of Turkey-TUBITAK (Project number: 117O754). Additionally, the first author received a scholarship from TUBITAK.
Disclosure Statement
The authors declare that they have no known competing interests to report.
REFERENCES
Acosta-Estrada B.A., Gutiérrez-Uribe J.A., Serna-Saldívar S.O. Bound phenolics in foods, a review. Food Chem. 2014;152:46–55. 10.1016/j.foodchem.2013.11.093
Bahorun T., Luximon-Ramma A., Crozier A., Aruoma O.I. Total phenol, flavonoid, proanthocyanidin and vitamin C levels and antioxidant activities of Mauritian vegetables. J. Sci. Food Agric. 2004;84:1553–1561. 10.1002/jsfa.1820
Bouayed J., Deußer H., Hoffmann L., Bohn T. Bioaccessible and dialysable polyphenols in selected apple varieties following in vitro digestion vs. their native patterns. Food Chem. 2012;131:1466–1472. 10.1016/j.foodchem.2011.10.030
Bovy A., Vos R. Kemper M., Schijlen E., Pertejo M.A., Muir S., et al. High-Flavonol Tomatoes Resulting from the Heterologous Expression of the Maize Transcription Factor Genes. Plant Cell. 2002;14:2509–2526. 10.1105/tpc.004218.growth
Brand-Williams W., Cuvelier M.E., Berset C. Use of a free radical method to evaluate antioxidant activity. LWT-Food Sci. Technol. 1995;28:25–30. 10.1016/S0023-6438(95)80008-5
Celep E., Inan Y., Akyuz S., Yesilada E. The bioaccessible phenolic profile and antioxidant potential of Hypericum perfoliatum L. after simulated human digestion. Ind. Crops Prod. 2017;109:717–723. 10.1016/j.indcrop.2017.09.032
Ciniviz M., Yildiz H. Determination of phenolic acid profiles by HPLC in lacto-fermented fruits and vegetables (pickle): Effect of pulp and juice portions. J. Food Process. Preserv. 2020;44:1–11. 10.1111/jfpp.14542
Ciska E., Karamac M., Acosta-Estrada B.A., Gutiérrez-Uribe J.A., Serna-Saldívar S.O. Bound phenolics in foods, a review. Food Chem. 2014;152:46–55. 10.1016/j.foodchem.2013.11.093
Cvetković B.R., Pezo L.L., Mišan A., Mastilović J., Kevrešan Ž., Ilić N., et al. The effects of osmotic dehydration of white cabbage on polyphenols and mineral content. LWT-Food Sci. Technol. 2019;110:332–337. 10.1016/j.lwt.2019.05.001
da Silva Fernandes M., Sanches Lima F., Rodrigues D., Handa C., Guelfi M., Garcia S., et al. Evaluation of the isoflavone and total phenolic contents of kefir-fermented soymilk storage and after the in vitro digestive system simulation. Food Chem. 2017;229: 373–380. 10.1016/j.foodchem.2017.02.095
Del-Toro-Sánchez C.L., Rodríguez-FélixF., Cinco-Moroyoqui F.J., Juárez J., Ruiz-Cruz S., Wong-Corral F.J., et al. Recovery of phytochemical from three safflower (Carthamus tinctorius L.) by-products: A ant properties, protective effect of human erythrocytes and profile by UPLC-DAD-MS. J. Food Process. Preserv. 2021;45:1–16. 10.1111/jfpp.15765
Demir K., Sarıkamış G., Çakırer Seyrek G. Effect of LED lights on the growth, nutritional quality and glucosinolate content of broccoli, cabbage and radish microgreens. Food Chem. 2023;401:134088. 10.1016/j.foodchem.2022.134088
Dewanto V., Wu X., Adom K.K., Liu R.H. Thermal processing enhances the nutritional value of tomatoes by increasing total antioxidant activity thermal processing enhances the nutritional value of tomatoes by increasing total antioxidant activity. J. Agric. Food Chem. 2002;50:3010–3014. 10.1021/jf0115589
Dimitry M.Y., Edith D.M.J., Therese B.A.M., Emmanuel P.A., Armand A.B., Leopold T.N., et al. Comparative evaluation of bioactive compounds, nutritional and physicochemical properties of five Cucurbita species flours of South Cameroon. S. Afr. J. Bot. 2002;145:458–467. 10.1016/j.sajb.2022.03.006
Ed Nignpense B., Latif S., Francis N., Blanchard C., Santhakumar A.B. The impact of simulated gastrointestinal digestion on the bioaccessibility and antioxidant activity of purple rice phenolic compounds. Food Biosci. 2022;47:101706. 10.1016/j.fbio.2022.101706
Fernandes S., Lima F.S., Rodrigues D., Handa C., Guelfi M., Garcia S., et al. Evaluation of the isoflavone and total phenolic contents of kefir-fermented soymilk storage and after the in vitro digestive system simulation. Food Chem. 2017;229: 373–380. 10.1016/j.foodchem.2017.02.095
Girgin N., El S.N. Effects of cooking on in vitro sinigrin bioaccessibility, total phenols, antioxidant and antimutagenic activity of cauliflower (Brassica oleraceae L. var. Botrytis). J. Food Compos. Anal. 2015;37:119–127. 10.1016/j.jfca.2014.04.013
Grand View Research, 2019. Packed pickles market size, share, trends analysis report by product (fruit, vegetable, meat, seafood) by packaging (jars, pouches), by distribution channel (supermarkets, hypermarkets, online) and segment forecasts, 2019–2025. https://www.grandviewresearch.com/industry-analysis/packed-pickles-market
Güleç A., Nergiz-Unal R., Akyol A., Acar J. Phenolic content and ascorbic acid are major contributors to antioxidant capacity of fruits and vegetables commonly consumed in Turkey. J. Food Agric. Environ. 2013;11:463–468.
Indexbox, 2016a. Global Cabbage Market. https://www.indexbox.io/search/cabbage-market/ . Accessed on 15-September-2022
Indexbox, 2016b. Global cucumber and gherkin market. https://app.indexbox.io/report/0707/0/ . Accessed on 15-September-2022
Indexbox, 2016c. Global imports of vegetable preparations; cucumbers and gherkins,prepared or preserved by vinegar and acetic acid. https://app.indexbox.io/report/200110/250/
Jaiswal A.K., Rajauria G., Abu-Ghannam N., Gupta S. Phenolic composition, antioxidant capacity and antibacterial activity of selected Irish Brassica vegetables. Nat Prod Commun. 2011;6:1299–1304.
Kaulmann A., André C.M., Schneider Y.J., Hoffmann L., Bohn T. Carotenoid and polyphenol bioaccessibility and cellular uptake from plum and cabbage varieties. Food Chem. 2016;197:325–332. 10.1016/j.foodchem.2015.10.049
Kiczorowski P., Kiczorowska B., Samolińska W., Szmigielski M., Winiarska-Mieczan A. Effect of fermentation of chosen vegetables on the nutrient, mineral, and biocomponent profile in human and animal nutrition. Sci. 2022;12:13422. 10.1038/s41598-022-17782-z
Kuljarachanan T., Fu N., Chiewchan N., Devahastin S., Chen X.D. In vitro digestion using dynamic rat stomach-duodenum model as an alternative means to assess bioaccessibility of glucosinolates in dietary fiber powder from cabbage. LWT. 2021;151(112243):1–8. 10.1016/j.lwt.2021.112243
Leonard, W., Zhang, P., Ying, D., Adhikari, B., Fang, Z. Fermentation transforms the phenolic profiles and bioactivities of plant-based foods. Biotechnol. Adv. 2021;49(107763):1–16. 10.1016/j.biotechadv.2021.107763
Liu H., Qiu N., Ding H., Yao R. Polyphenols contents and antioxidant capacity of 68 Chinese herbals suitable for medical or food uses. Food Res. Int. 2008;41:363–370. 10.1016/j.foodres.2007.12.012
Maribel Perez-Perez L., García-Borbón L., Iván González-Vega R., Carlos Rodríguez-Figueroa J., Carina Rosas-Burgos E., Ángel Huerta-Ocampo J., et al. Release of linked phenolic compounds in chickpea (Cicer arietinum L.) using intestinal human microbiota. Biotecnia. 2018;3:146–154.
Miceli N., Trovato A., Dugo P., Cacciola F., Donato P., Marino A., et al. Comparative analysis of flavonoid profile, antioxidant and antimicrobial activity of the berries of Juniperus communis L. var. communis and Juniperus communis L. var. saxatilis Pall, from Turkey. J. Agric. Food Chem. 2009;57:6570–6577. 10.1021/jf9012295
Miller N.J., Rice-Evans C.A. Factors influencing the antioxidant activity determined by the ABTS radical cation assay. Free Radic Res. 1997;26:195–199. 10.3109/10715769709097799
Minekus M., Alminger M., Alvito P., Ballance S., Bohn T., Bourlieu C., et al. A standardised static in vitro digestion method suitable for food–an international consensus. Food Funct. 2014;5:1113–1124. 10.1039/C3FO60702J
Mohamed G.A., Ibrahim S.R.M., El-Agamy D.S., Elsaed W.M., Sirwi A., Asfour H.Z., et al. Cucurbitacin E glucoside alleviates concanavalin A-induced hepatitis through enhancing SIRT1/Nrf2/HO-1 and inhibiting NF-ĸB/NLRP3 signaling pathways. J. Ethnopharmacol. 2022;292:115223. 10.1016/j.jep.2022.115223
Murthy H.N., Dewir Y.H., Dalawai D., Al-Suhaibani N. Comparative physicochemical analysis of seed oils of wild cucumber (Cucumis sativus var. hardwickii (Royle) Alef.), cucumber (Cucumis sativus L. var. sativus), and gherkin (Cucumis anguria L.). S. Afr. J. Bot. 2022;145:186–191. 10.1016/j.sajb.2021.06.004
Omokhua-Uyi A.G., van Staden J. Phytomedicinal relevance of South African Cucurbitaceae species and their safety assessment: A review. J. Ethnopharmacol. 2020;259:112967. 10.1016/j.jep.2020.112967
Parada R.B., Marguet E., Campos C.A., Vallejo M. Improving the nutritional properties of Brassica L. vegetables by spontaneous fermentation. Foods Raw Mater. 2022;10:97–105. 10.21603/2308-4057-2022-1-97-105
Prior R.L. The Chemistry behind Antioxidant Capacity Assays. J. Agric. Food Chem. 2005;53(6):1841–1856. 10.1021/jf030723c
Rashmi H.B., Negi P.S. Phenolic acids from vegetables: A review on processing stability and health benefits. Food Res. Int. 2020;136:109298. 10.1016/j.foodres.2020.109298
Sayın F.K., Alkan S.B. The effect of pickling on total phenolic contents and antioxidant activity of 10 vegetables. J. Food Health Sci. 2015;10:135–141. 10.3153/JFHS15013
Singh R.P., Chidambara Murthy K.N., Jayaprakasha G.K. Studies on the antioxidant activity of pomegranate (Punica granatum) peel and seed extracts using in vitro models. J. Agric. Food Chem. 2002;50:81–86. 10.1021/jf010865b
Song W., Derito C.M., Liu M.K., He X., Dong M., Liu R.H. Cellular antioxidant activity of common vegetables. J. Agric. Food Chem. 2010;58:6621–6629. 10.1021/jf9035832
Statistica Research Department, 2022. U.S population: Consumption of pickles from 2011 to 2024. https://www.statista.com/statistics/283153/us-households-consumption-of-pickles-trend/
Tao Y., Han M., Gao X., Han Y., Show P.L., Liu C., et al. Applications of water blanching, surface contacting ultrasound-assisted air drying, and their combination for dehydration of white cabbage: Drying mechanism, bioactive profile, color and rehydration property. Ultrason. Sonochem. 2019;53:192–201. 10.1016/j.ultsonch.2019.01.003
Tapia-Hernández J.A., Rodríguez-Felix F., Juárez-Onofre J.E., Ruiz-Cruz S., Robles-García M.A., Borboa-Flores J., et al. Zein-polysaccharide nanoparticles as matrices for antioxidant compounds: A strategy for prevention of chronic degenerative diseases. Food Res. Int. 2018;111:451–471. 10.1016/j.foodres.2018.05.036
Thomas-Valdés S., Theoduloz C., Jiménez-Aspee F., Burgos-Edwards A., Schmeda-Hirschmann G. Changes in polyphenol composition and bioactivity of the native Chilean white strawberry (Fragaria chiloensis spp. chiloensis f. chiloensis ) after in vitro gastrointestinal digestion. Food Res. Int. 2018;105:10–18. 10.1016/j.foodres.2017.10.074
Ti H., Zhang R., Li Q., Wei Z., Zhang M. Effects of cooking and in vitro digestion of rice on phenolic profiles and antioxidant activity. Food Res. Int. 2015;76:813–820. 10.1016/j.foodres.2015.07.032
Tlais A.Z.A., Kanwal S., Filannino P., Acin Albiac M., Gobbetti M., di Cagno R. Effect of sequential or ternary starters-assisted fermentation on the phenolic and glucosinolate profiles of sauerkraut in comparison with spontaneous fermentation. Food Res. Int. 2022;156:111116. 10.1016/j.foodres.2022.111116
Tomas M., Beekwilder J., Hall R.D., Diez C., Sagdic O., Capanoglu E. Effect of dietary fiber ( inulin ) addition on phenolics and in vitro bioaccessibility of tomato sauce. Food Res. Int. 2018;106:129–135. 10.1016/j.foodres.2017.12.050
Tomas M., Zhang L., Zengin G., Rocchetti G., Capanoglu E., Lucini L. Metabolomic insight into the profile, in vitro bioaccessibility and bioactive properties of polyphenols and glucosinolates from four Brassicaceae microgreens. Food Res. Int. 2021;140:110039. 10.1016/j.foodres.2020.110039
Vanhoutte H. Optimization and characterization of nonextractable phenolic compounds from Brassica waste streams. Master Thesis. Gent University: Belgium; 2014
Wang Y., Zhang M., Mujumdar A.S. Influence of green banana flour substitution for cassava starch on the nutrition, color, texture and sensory quality in two types of snacks. LWT-Food Sci. Technol. 2012;47:175–182. 10.1016/j.lwt.2011.12.011
Yao L.H., Jiang Y.M., Shi J., Tomás-Barberán F., Datta N., Singanusong R., et al. Flavonoids in food and their health benefits. Plant Foods Hum. Nutr. 2004;59:113–122. 10.1007/s11130-004-0049-7
Zhao D., Shah N.P. Lactic acid bacterial fermentation modified phenolic composition in tea extracts and enhanced their antioxidant activity and cellular uptake of phenolic compounds following in vitro digestion. J. Funct. Foods. 2016;20:182–194. 10.1016/j.jff.2015.10.033
Zhou B., Huang W., Feng X., Liu Q., Ibrahim S.A., Liu Y. Identification and quantification of intact glucosinolates at different vegetative growth periods in Chinese cabbage cultivars by UHPLC-Q-TOF-MS. Food Chem. 2022;393:133414. 10.1016/j.foodchem.2022.133414